
- The Japanese yen strengthened after verbal intervention by Japanese finance minister Suzuki.
- On Tuesday, USD/JPY fell towards a daily low around 136.50 before settling near June 21 highs.
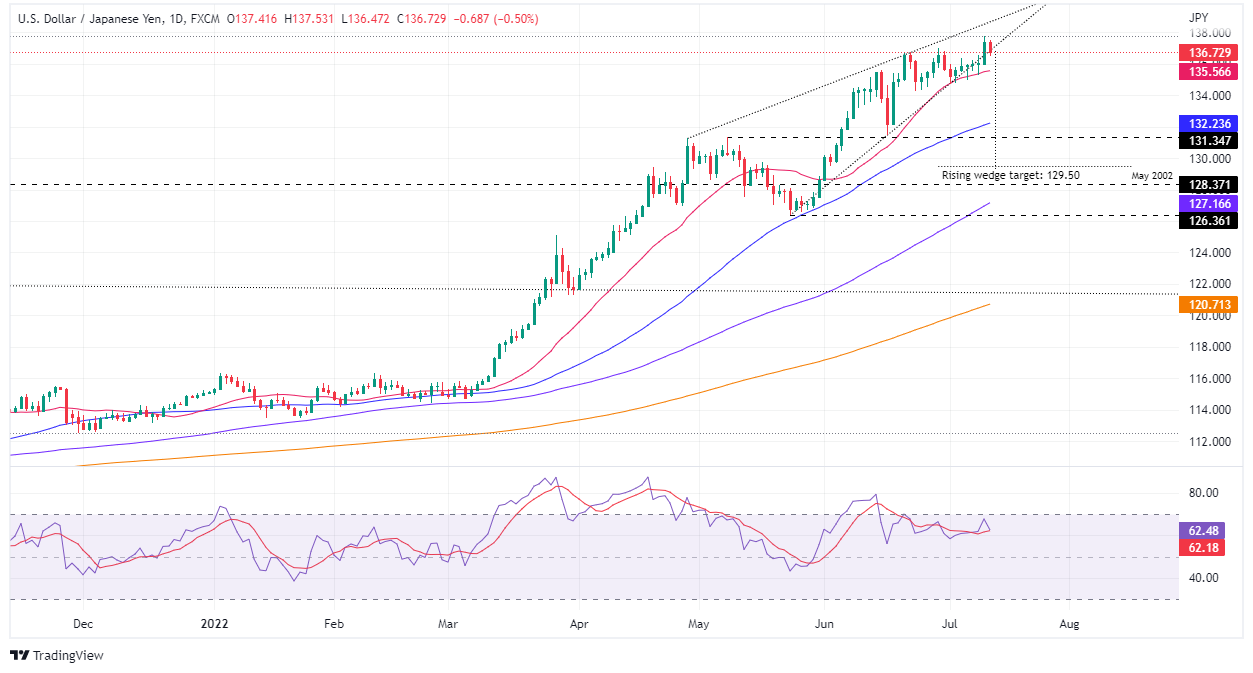
- USD/JPY Price Analysis: The currency is still bullish, but a rising wedge has formed which points to a drop towards 129.50.
The USD/JPY retreats from 24-year highs around 137.75, falling more than 100 pips during the American session, due to falling US bond yields and talks between US Treasury Secretary Janet Yellen, and the Japanese Finance Minister, Suzuki, in which he informed him of the weakening of the yen and agreed to continue consulting on foreign exchange.
At the time of writing, USD/JPY is trading at 136.73, down by more than half, after reaching a daily high around 137.53, to stumble to fresh daily lows below 136.50 before settling on around current price levels.
USD/JPY daily chart
The USD/JPY daily chart shows the pair trending up, albeit forming a rising wedge, which means that selling pressure could be around the corner to intervene in the pair and drag it lower. Also, the Relative Strength Index (RSI) is breaking out of overbought conditions and about to cross below the RSI 7-day SMA, which would open the door for further declines.
If the USD/JPY breaks below the rising wedge, its first support would be the 20-day EMA at 135.56. Once broken through, the next demand zone to test would be the 1 Jul low at 134.74, followed by the 50 day EMA at 132.23, on its way to the measured target using the upper and lower trend lines that form the rising wedge around 129.50.
Key USD/JPY Technical Levels
Source: Fx Street
With 6 years of experience, I bring to the table captivating and informative writing in the world news category. My expertise covers a range of industries, including tourism, technology, forex and stocks. From brief social media posts to in-depth articles, I am dedicated to creating compelling content for various platforms.


