
- The USD/JPY pair fell for two consecutive days after statements by the Japanese authorities indicating increased scrutiny of movements in the currency markets.
- The Japanese yen strengthened in response to the news, putting downward pressure on the USD/JPY pair.
- The USD/JPY pair maintains a bullish bias as long as it remains above the key 138.74 level, which represents the daily high on May 18.
The pair USD/JPY it fell for two consecutive days after Japanese authorities said they would watch foreign exchange movements, following a meeting between the Bank of Japan and Masato Kanda, deputy finance minister for international affairs. Following those statements, the Japanese yen (JPY) strengthened. At the time of writing, the USD/JPY pair is trading at 139.87, down 0.40%.
USD/JPY Price Analysis: Technical Insights
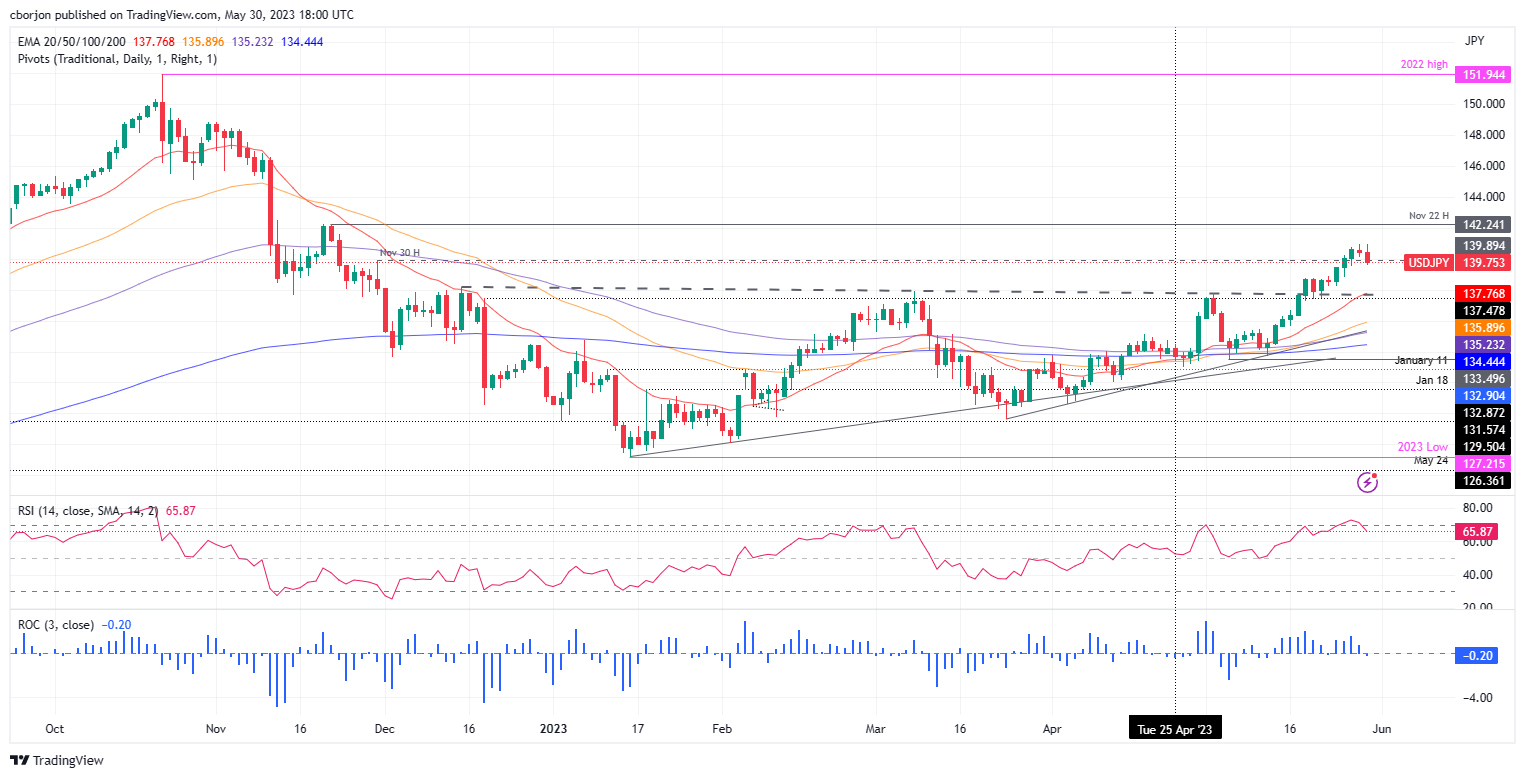
The USD/JPY pair maintains a bullish bias as long as it remains above the May 18 daily high of 138.74, although the recent pullback could be attributed to deteriorating market sentiment. Also, the RSI emerging from overbought conditions could be one reason, along with falling US Treasury yields.
That being said, the first support for USD/JPY would be the 139.00 zone. A break of the latter would expose the May 18 high, followed by the 138.00 figure. Below, the confluence of a previous resistance-turned-support trend line and the 20-day EMA at 137.76.
Conversely, if buyers recapture 140.00, this could open the door for further rises, such as a year-to-date high of 140.93, before challenging 141.00.
USD/JPY Price Action – Daily Chart
Source: Fx Street
I am Joshua Winder, a senior-level journalist and editor at World Stock Market. I specialize in covering news related to the stock market and economic trends. With more than 8 years of experience in this field, I have become an expert in financial reporting.


