
- USD/JPY declines and hits an eight-week low.
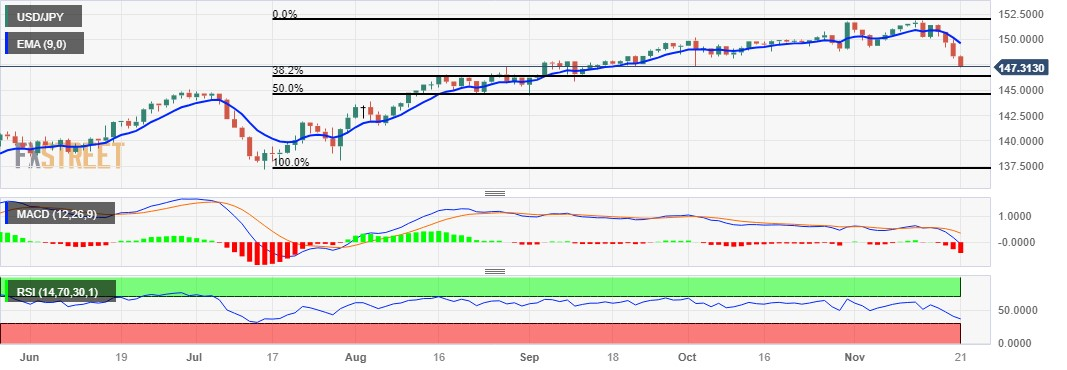
- The 147.00 psychological level appears to be key support following the 38.2% Fibonacci retracement.
- A breakout of the 148.00 level could serve as support for the pair to explore the area near the nine-day EMA.
He USD/JPY extended the losing streak that began on Thursday and marked an eight-week low, trading around 147.40 during the European session on Tuesday. The psychological level of 147.00 is emerging as immediate support following the 38.2% Fibonacci retracement at 146.32.
The US dollar has fallen to almost three-month lows, influenced by dovish expectations from the Federal Reserve (Fed). This development is a major factor contributing to the decline of the USD/JPY pair.
The 14-day Relative Strength Index (RSI) is below the 50 level, signaling weaker sentiment for the USD/JPY pair. This could lead to bearish moves towards the psychological support zone around 146.00. If there is a decisive break below this level, it could pave the way for the USD/JPY pair to navigate the zone near the 50.0% retracement at the 144.60 level.
Furthermore, the moving average convergence divergence (MACD) line is positioned below the center line and diverges below the signal line, indicating bearish momentum in the market for the USD/JPY pair.
To the upside, the main level at 147.50 serves as an immediate barrier, followed by the psychological level at 148.00. If this last level is broken, the USD/JPY could have support to explore the 149.00 area, behind the nine-day EMA at 149.62.
USD/JPY: Daily Chart
Source: Fx Street
I am Joshua Winder, a senior-level journalist and editor at World Stock Market. I specialize in covering news related to the stock market and economic trends. With more than 8 years of experience in this field, I have become an expert in financial reporting.


