
- USD/JPY is under strong selling pressure amid a sharp USD pullback from a multi-month high.
- The policy divergence between the Fed and the Bank of Japan supports the prospects for buying on the downside at lower levels.
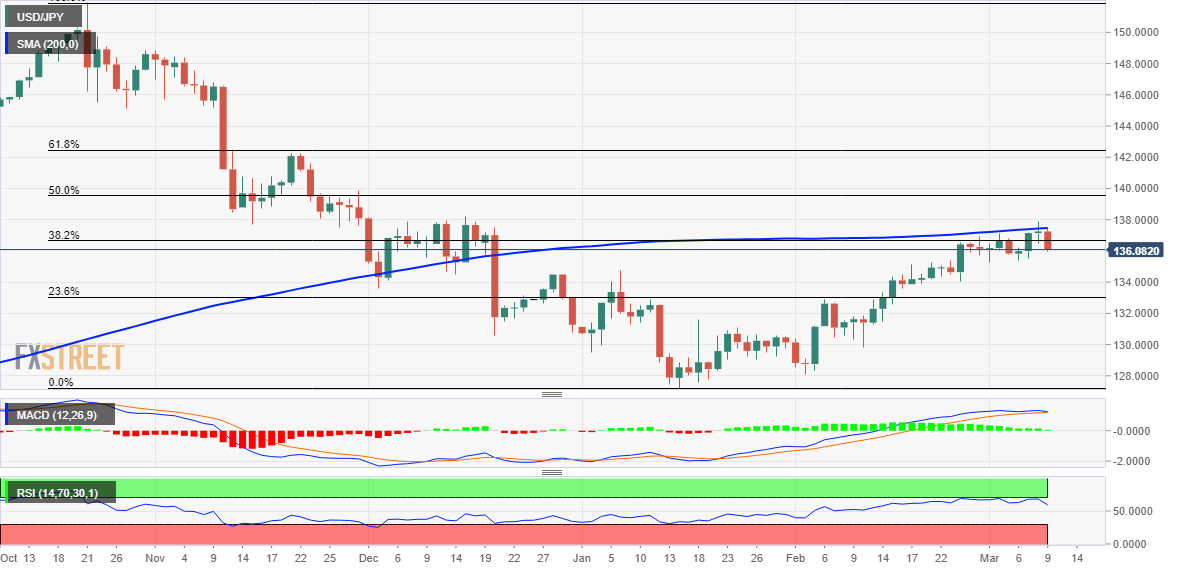
- The failure to find acceptance above the 200-day SMA warrants some caution on the part of the bulls.
The pair USD/JPY meets a fresh offer on Thursday and extends the previous day’s modest pullback from near 138.00, or its highest level since mid-December. Intraday selling picked up during the early hours of the American session and momentarily dragged the pair below 136.00 in the last hour.
US dollar bulls are opting to take some profits after the recent strong rally, which has broken a three-month high, turns out to be a key factor putting pressure on USD/JPY. Apart from this, the decline could be attributed to some repositioning trade ahead of the Bank of Japan (BOJ) monetary policy decision, which will be announced during the Asian session on Friday.
However, the dollar’s decline is more likely to be cushioned by increasing bets on a 50 basis point hike at the March FOMC meeting. By contrast, the Bank of Japan is expected to maintain its ultra-easy monetary policy in support of the fragile domestic economy. The divergence between the policies adopted by the two main central banks supports the prospects for falls around the USD/JPY pair.
From a technical point of view, the fact that the pair failed to break above the important 200-day SMA overnight justifies the caution of bullish traders. Therefore, it would be prudent to wait for a sustained move beyond the overnight high, around the 137.90 area, before positioning for further gains. The USD/JPY pair could climb to the 138.50 barrier on its way to the 139.00 zone.
On the other hand, if the pair continues to fall, it is likely to attract new buyers near the 135.35 horizontal support zone. That being said, a convincing break, leading to further weakness below the key psychological 135.00 level, could shift the short-term bias in favor of the bears. The price could accelerate the decline towards the 134.75-134.70 zone before finally falling to the 134.25 zone and the round figure of 134.00.
USD/JPY daily chart
Key levels to watch
Source: Fx Street
I am Joshua Winder, a senior-level journalist and editor at World Stock Market. I specialize in covering news related to the stock market and economic trends. With more than 8 years of experience in this field, I have become an expert in financial reporting.


