
- USD/JPY continues its weekly uptrend and hits a new yearly high on Friday.
- Sustained USD buying provides support amid uncertainty over the BOJ’s policy path.
- The technical setup supports prospects for an extension of the positive move.
The pair USD/JPY gains strong positive traction on the last day of the week and rises to a nearly two-month high heading into the North American session. The pair is currently hovering around the key psychological level of 135.00 and looks set to take advantage of the recent appreciation move of the last two weeks or so.
The Japanese yen (JPY) is weakening across the board amid uncertainty over the direction of monetary policy under new Bank of Japan (BoJ) Governor Kazuo Ueda. The dollar, for its part, reaches a new six-week high, on expectations that the Federal Reserve will maintain its hawkish stance in the face of persistently high inflation. This turns out to be a key factor pushing the USD/JPY pair higher.
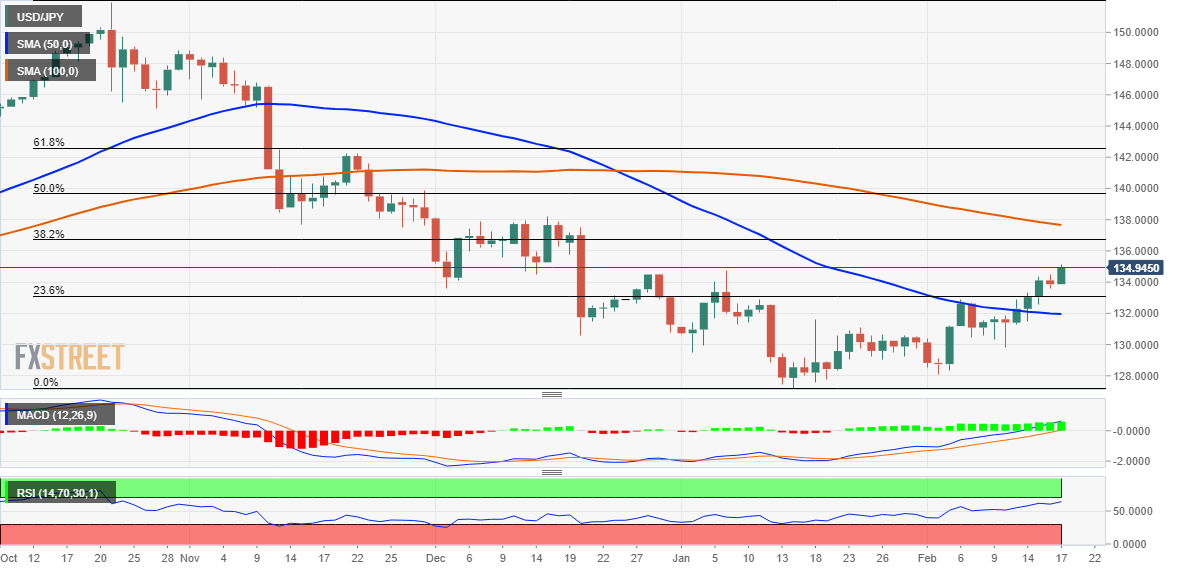
From a technical point of view, the sustained breakout of the 50-day SMA this week and the subsequent move beyond the 132.90-133.00 bid zone was seen as a key trigger for bullish traders. This latest signal marks the 38.2% Fibonacci retracement level of the recent retracement from a three-decade high reached in October and should now act as a solid short-term base for the USD/JPY pair.
Meanwhile, any significant drop below the immediate support of 134.80-134.75 is likely to attract fresh buyers near the 134.40 zone. This, in turn, should help cap the decline for the USD/JPY pair near the round 134.00 level. However, a convincing break below could trigger technical selling and pave the way for a pullback towards the strong resistance breakout point of 133.00.
On the other hand, the USD/JPY pair looks set to rally towards the 135.55-135.60 horizontal zone and eventually try to recover 136.00. Momentum could extend further towards the 136.75-136.85 confluence resistance, which comprises the 38.2% Fibonacci level and a technically significant 200-day SMA. Further sustained strength will suggest that the pair has bottomed out.
USD/JPY daily chart
Key levels to watch
Source: Fx Street
I am Joshua Winder, a senior-level journalist and editor at World Stock Market. I specialize in covering news related to the stock market and economic trends. With more than 8 years of experience in this field, I have become an expert in financial reporting.


