
- The USD/JPY pair falls back for the second day in a row and hits a new 1-month low on Thursday.
- The risk averse state benefits the safe-haven yen and weighs on the pair against a backdrop of weaker dollar.
- The break below the 61.8% Fibonacci level could have set the stage for a further depreciation move.
The pair USD/JPY it falls back for the second day in a row on Thursday – also marking the fifth day of a negative move in the previous six – and remains depressed during the early North American session. The pair is trading at a new 1-month low around the 132.15 zone in the last hour and is being pressured by a combination of factors.
Despite Credit Suisse announcing that it will exercise a loan option of up to $54 billion from the Swiss National Bank (SNB) to restore investor confidence, fears of a systemic crisis continue to weigh on risk sentiment. This is evidenced by a further decline in US stock futures, which benefits the safe-haven Japanese yen and puts pressure on USD/JPY.
The global flight to safety leads to a further decline in US Treasury yields, keeping dollar bulls on the defensive and contributing to the offered tone surrounding the USD/JPY pair. Meanwhile, the disappointing release of the Philly Fed Manufacturing Index offsets better-than-expected US jobless claims and housing market data and does little to boost momentum.
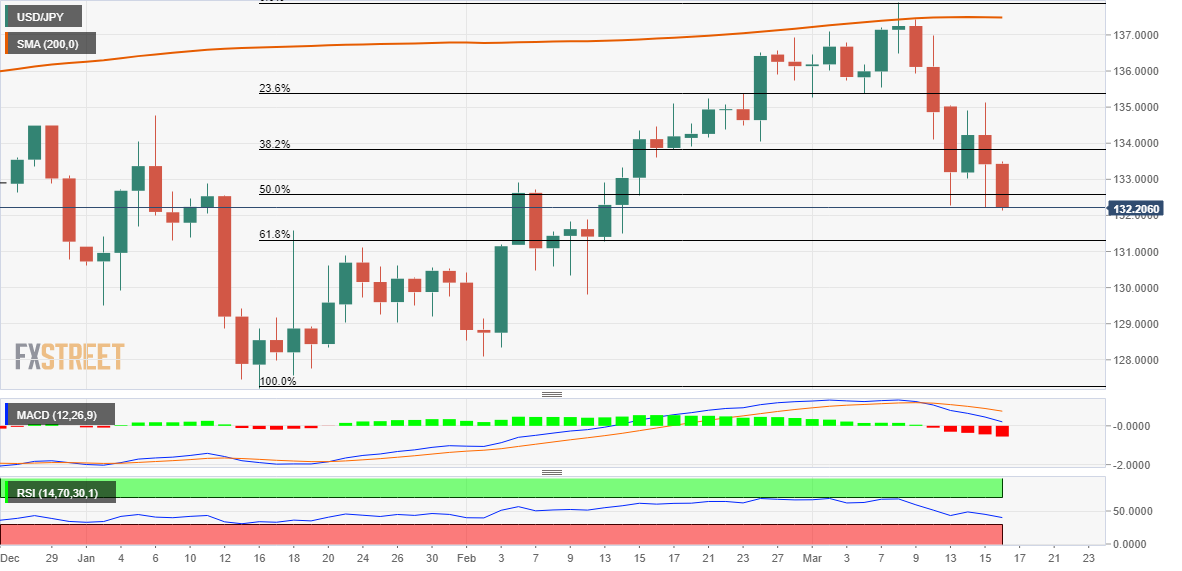
From a technical perspective, the intraday slide drags the USD/JPY pair back below the 50% Fibonacci retracement level of the recent rally from the January monthly swing low. On the other hand, the oscillators on the daily chart have started to gain negative traction. Therefore, continued selling below 132.00 will be seen as a new trigger for the bears and pave the way for further losses.
The USD/JPY pair could then accelerate the decline towards the next relevant support marked by the 61.8% Fibonacci level, around the 131.25 zone. This level is followed by near 131.00, below which the bearish trajectory could extend further towards the 130.60 intermediate support before the pair finally falls to the key psychological 130.00 level.
On the flip side, recovery attempts could face strong resistance near the round 133.00 level, ahead of the daily high around the 133.50 zone. Any further move higher is more likely to occur in the 133.50 area. Any further move higher is more likely to attract new sellers and remain capped near the 133.80 zone, or the 38.2% Fibonacci level, which should now act as a pivot point for the USD/JPY pair.
USD/JPY daily chart
Key levels to watch
Source: Fx Street
I am Joshua Winder, a senior-level journalist and editor at World Stock Market. I specialize in covering news related to the stock market and economic trends. With more than 8 years of experience in this field, I have become an expert in financial reporting.
 meeting for peace: “First step towards reconciliation”")


