
- USD/JPY posts a minimal loss after hitting a daily low of 160.28.
- The technical outlook shows an intact uptrend, with the RSI in overbought conditions indicating strong buying momentum.
- Key Resistance Levels: Psychological 161.00 and 162.00, followed by November 1986 high of 164.87 and April 1986 high of 178.
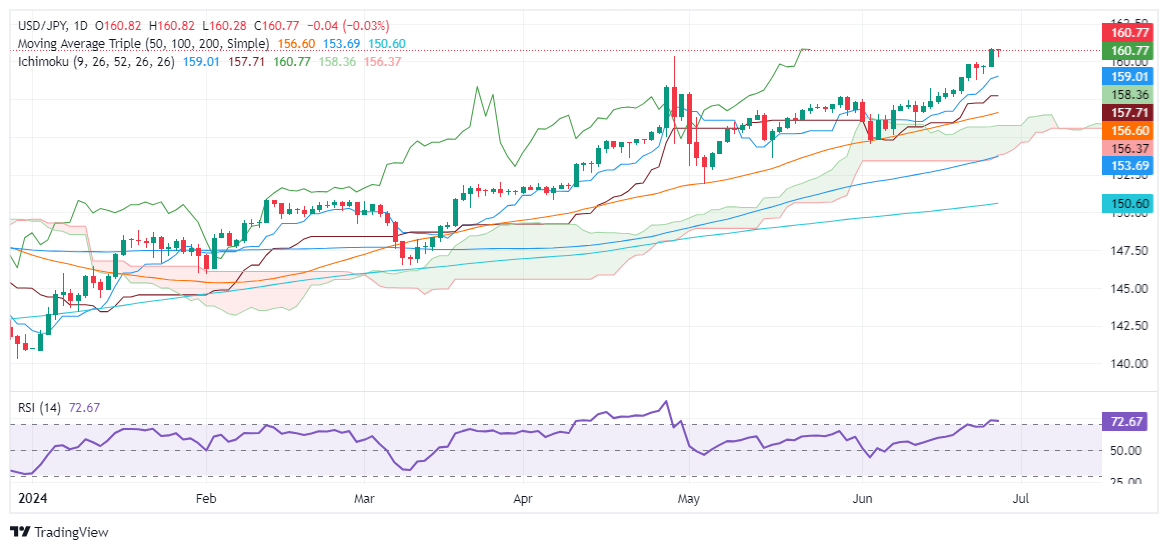
- Key Support Levels: Tenkan-Sen at 159.01, June 24 low 158.75, Senkou Span A at 158.36 and Kijun-Sen at 157.70.
USD/JPY registers a minimal loss after reaching a daily low of 160.28, however, the pair continues to approach the figure of 161.00 for the second consecutive day, as verbal statements from the Japanese authority have failed to contain the depreciation of the And in. The pair is trading at 160.77, down 0.03%.
USD/JPY Price Analysis: Technical Outlook
The USD/JPY uptrend remains intact, although traders remain cautious after reclaiming the psychological figure of 160.00, seen as the first line of defense for Japanese authorities to intervene in the currency markets. However, the pair continued to advance steadily, although the risks of an intervention increased.
Momentum favors buyers, with the RSI in overbought conditions. However, due to the strength of the uptrend, most technicians use 80 as “extremely” overextended conditions.
That said, the first resistance for the USD/JPY would be the psychological levels of 161.00, 162.00, and so on, before testing the November 1986 high of 164.87, followed by the April 1986 high of 178.
Conversely, if USD/JPY falls below 160.00, the first support would be the Tenkan-Sen at 159.01, followed by the June 24 low of 158.75. Once those levels clear, the next stop would be the Senkou Span A at 158.36 and then the Kijun-Sen at 157.70.
USD/JPY Price Action – Daily Chart
Japanese Yen PRICE Today
The table below shows the percentage change of the Japanese Yen (JPY) against major currencies today. Japanese yen was the strongest currency against the Swiss franc.
| USD | EUR | GBP | JPY | CAD | AUD | NZD | CHF | |
|---|---|---|---|---|---|---|---|---|
| USD | -0.23% | -0.15% | -0.03% | -0.05% | -0.02% | -0.04% | 0.14% | |
| EUR | 0.23% | 0.06% | 0.17% | 0.16% | 0.23% | 0.16% | 0.36% | |
| GBP | 0.15% | -0.06% | 0.14% | 0.10% | 0.16% | 0.12% | 0.31% | |
| JPY | 0.03% | -0.17% | -0.14% | -0.02% | 0.00% | -0.05% | 0.18% | |
| CAD | 0.05% | -0.16% | -0.10% | 0.02% | 0.02% | 0.00% | 0.19% | |
| AUD | 0.02% | -0.23% | -0.16% | -0.01% | -0.02% | -0.02% | 0.15% | |
| NZD | 0.04% | -0.16% | -0.12% | 0.05% | -0.01% | 0.02% | 0.18% | |
| CHF | -0.14% | -0.36% | -0.31% | -0.18% | -0.19% | -0.15% | -0.18% |
The heat map shows percentage changes for major currencies. The base currency is selected from the left column, while the quote currency is selected from the top row. For example, if you choose the Japanese Yen from the left column and move along the horizontal line to the US Dollar, the percentage change shown in the box will represent the JPY (base)/USD (quote).
Source: Fx Street
I am Joshua Winder, a senior-level journalist and editor at World Stock Market. I specialize in covering news related to the stock market and economic trends. With more than 8 years of experience in this field, I have become an expert in financial reporting.


