
- USD/JPY gains strong positive momentum and recoups much of the previous day’s losses.
- A rebound in US bond yields reignites demand for the USD and provides support for the pair.
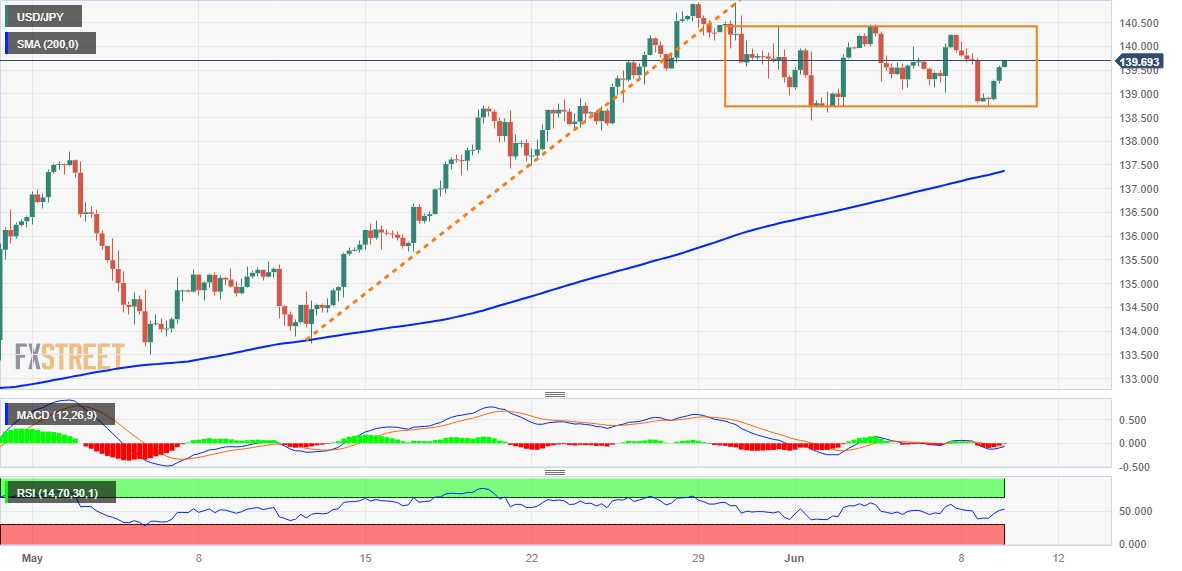
- The technical situation favors the bulls and supports the prospects for further appreciation.
The USD/JPY pair recovers from a new weekly low, around the 138.75 zone hit this Friday, and continues its intraday rise during the European session. The pair rises above 139.50, reversing much of the previous day’s losses.
A modest rebound in US Treasury yields helps reignite demand for the US Dollar (USD) and helps the USD/JPY pair attract some buyers near the lower end of the recent range held over the last week. Meanwhile, concerns over a global economic downturn continue to weigh on investor sentiment, which in turn could benefit the safe-haven Japanese Yen (JPY) and act as a headwind for the pair.
From a technical point of view, the recent range-bound price movement over the last two weeks constitutes the formation of a rectangle on short-term charts. Against the backdrop of a recovery from 133.50, the May monthly low, this could still be classified as a bullish consolidation phase. This outlook is bolstered by the fact that the daily chart oscillators remain comfortably in bullish territory.
In addition, the technical indicators on the hourly chart have also begun to move into positive territory, supporting the prospects for a further intraday appreciation move. Therefore, a rally towards the psychological 140.00 level is very likely, en route to range resistance near the 140.25 area. Bulls, however, could pause near that barrier amid speculation of larger interventions by the Bank of Japan (BoJ).
Investors may also prefer to stay out of next week’s key central bank risks: the expected FOMC policy decision on Wednesday, followed by the BoJ meeting on Thursday.
In the meantime, any significant pullback could still find decent support near the 139.00 level ahead of the 138.75-138.70 region. A convincing break below this last zone would nullify the constructive setup and trigger aggressive technical selling. The USD/JPY pair could then accelerate the decline towards the monthly low, around the 138.45-138.40 zone, on the way towards the 138.00 level and the 137.30 zone, where the 200-day SMA is expected.
USD/JPY 4-hour chart
USD/JPY additional technical levels
Source: Fx Street
I am Joshua Winder, a senior-level journalist and editor at World Stock Market. I specialize in covering news related to the stock market and economic trends. With more than 8 years of experience in this field, I have become an expert in financial reporting.


