
- USD/JPY continues winning streak following Fed Chairman Jerome Powell’s hawkish comments.
- Technical indicators suggest bullish momentum to approach the round level of 152.00.
- The 21-day EMA could act as key support on the downside.
USD/JPY continues its bullish trajectory and trades around yearly highs at 151.70 during the European session on Monday. The USD/JPY pair sees a possible rise towards the resistance of the psychological level of 152.00. This could materialize if US Dollar (USD) strength gains momentum, driven by rising US Treasury yields and hawkish comments from Federal Reserve (Fed) Chair Jerome Powell .
Technical indicators paint an interesting picture for the USD/JPY pair. The 14-day Relative Strength Index (RSI) is positioned above the 50 level, indicating bullish support. This signals upward momentum and reflects strong sentiment in the markets. With this, there is potential for the pair to advance towards the next barrier at the 152.50 resistance level.
Furthermore, the MACD line is above the center line and the signal line in the USD/JPY pair. This setup suggests stronger momentum and reflects prevailing confidence in the market.
On the other hand, the USD/JPY pair could encounter the support of the 21-day EMA at 150.35, followed by the psychological level of 150.00. A decisive break below this last level could push the pair to navigate the zone around the 23.6% Fibonacci retracement at 148.40.
USD/JPY daily chart
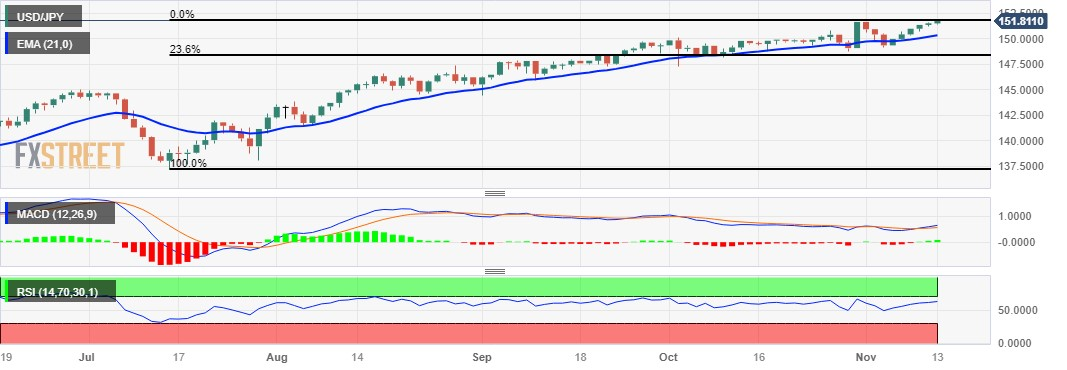
Source: Fx Street
I am Joshua Winder, a senior-level journalist and editor at World Stock Market. I specialize in covering news related to the stock market and economic trends. With more than 8 years of experience in this field, I have become an expert in financial reporting.


