
- USD/JPY soars and challenges the 133.00 barrier.
- The dollar rises along with the new rise in US Treasury yields.
- Kuroda’s intervention fails despite the pair being overbought on the daily chart.
USD/JPY is at its highest level in the last 20 years, just below the 133.00 barrier, as the bulls take a breather before the next push higher.
The fresh rise in the US dollar offered the needed boost to USD/JPY buyers, leading the pair closer to the 133.00 level. This is because US Treasury yields broke out of their consolidation to the upside early in the European session.
On Tuesday, the pair briefly reversed after Bank of Japan (BoJ) Governor Haruhiko Kuroda verbally intervened, noting that the yen’s “big drop in a short period of time is negative for the economy.”
Looking ahead, the pair looks likely to continue rising as the dollar is likely to extend its rally alongside yields amid return of recession fears. The main central banks are immersed in an aggressive tightening cycle, which raises fears of a global economic slowdown.
Technically, the USD/JPY daily chart shows that the confirmation of the previous week’s bullish wedge has allowed the bulls to embark on a new uptrend.
The immediate hurdle to the upside is now at the psychological level of 133.50 as the buying pressure around the pair remains relentless.
USD/JPY daily chart
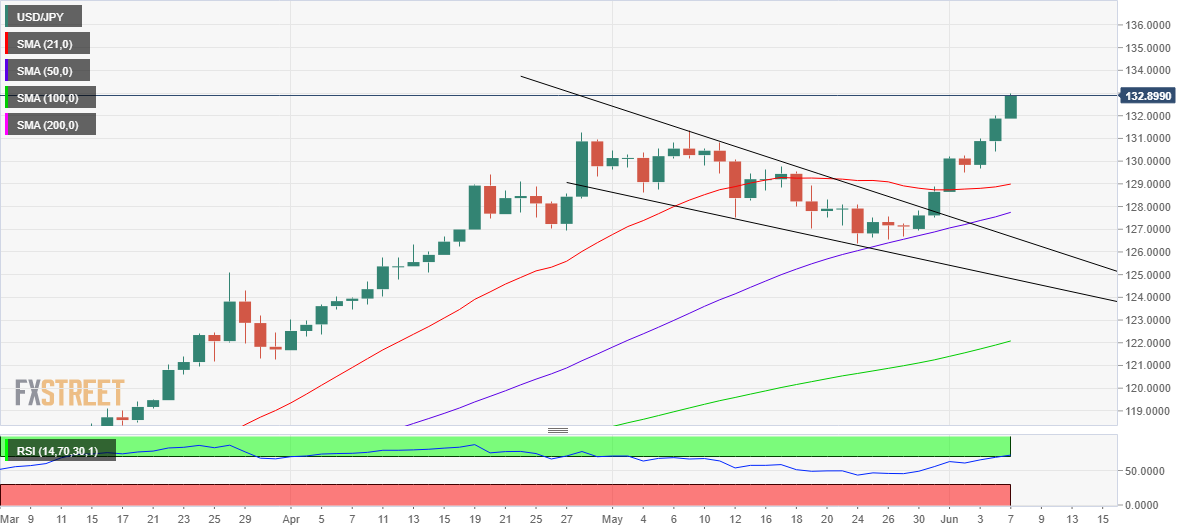
However, the 14-day RSI is peeking into overbought territory, challenging the bulls’ commitment.
A correction could occur as price has broken above the measured pattern target at 132.77.
If a corrective decline occurs, the pair could pull back towards the 132.00 area, below which the daily low of 131.87 would come to the rescue of the bulls.
Further down, Monday’s low of 130.43 will be on sellers’ radar.
USD/JPY additional levels
Source: Fx Street
With 6 years of experience, I bring to the table captivating and informative writing in the world news category. My expertise covers a range of industries, including tourism, technology, forex and stocks. From brief social media posts to in-depth articles, I am dedicated to creating compelling content for various platforms.


