
- USD/JPY loses for the second week in a row, 1.10%.
- The USD remained strong in the session, buoyed by a sour market mood, as US stocks hit new 52-week lows.
- USD/JPY Price Forecast: Ranged, Lacking Catalyst That Can Rock The Ship.
The USD/JPY continues to fall for the third day in a row, although the downtrend hit the daily low of 27 Apr at 126.94, keeping the major currency’s uptrend intact amid a bear market environment on the last trading day of the week , since the closing of Wall Street is approaching. At 127.82, USD/JPY posts a minimal gain of 0.04%.
US equities sink between 1.51% and 2.49%. The Dow Jones and Nasdaq hit a 52-week low, despite efforts by the People’s Bank of China (PBoC) to stimulate the Chinese economy when it cut rates on the 5-year lending prime rate (LPR) by 0.15. %. Although the decision was applauded by investors in the Asian and European sessions, it was ignored in the New York session, as the expiration of options linked to equities and ETFs increased volatility.
Meanwhile, the dollar index, which measures the value of the USD against its peers, recovers 0.23% on the day and stands at 103,102. By contrast, US Treasury yields, led by the 10-year Treasury yield, are down from a high of 3% on the week to 2,774%, a headwind for USD/ JPY due to its positive correlation.
USD/JPY Price Forecast: Technical Outlook
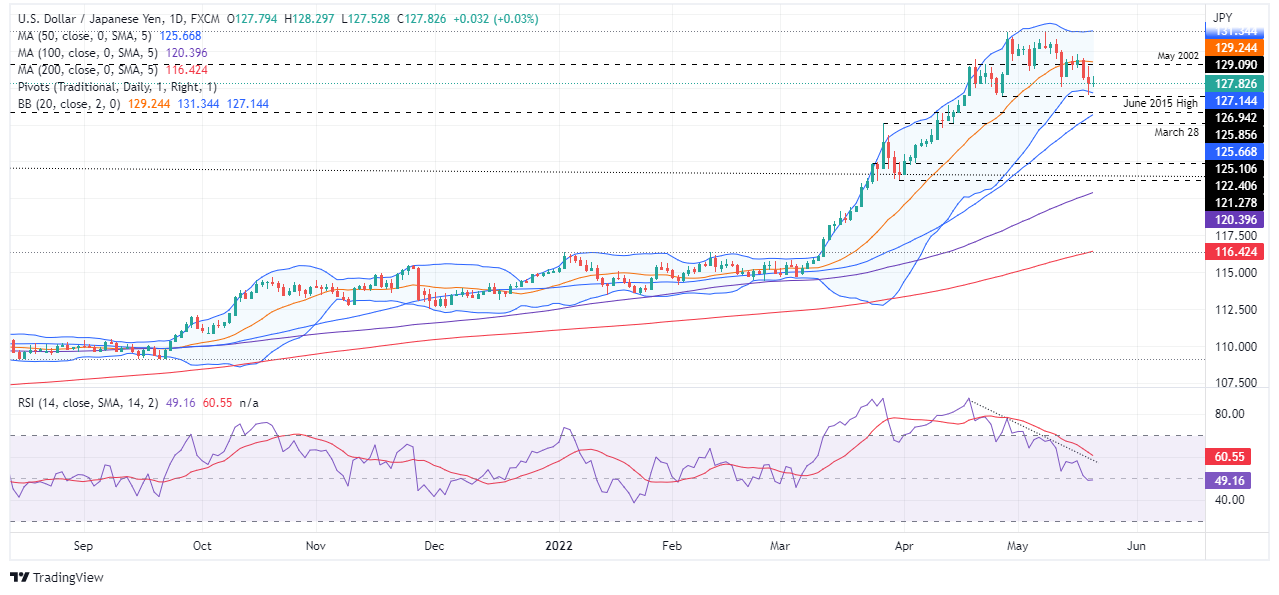
USD/JPY price action propelled it to the lower Bollinger band line around 127.12, where some USD/JPY buyers pushed the price higher towards current levels. It is worth noting that the USD/JPY went from having a bullish bias to being neutral due to the fact that the price remained in the 127.00-129.78 range, unable to trade beyond that range, in the absence of a new impulse that could lead to the pair towards new weekly lows/highs, respectively.
To the upside, the first resistance of the USD/JPY would be 128.00. A breakout of the latter would expose essential resistance levels. First up is the May 18 daily high at 129.53, followed by 130.00, and the yearly high at 131.34. On the other hand, the first support for USD/JPY would be the daily low of May 19 at 127.02. A break below would expose the Apr 27 low at 126.94, followed by the 50 DMA at 125.66.
Technical levels
Source: Fx Street
With 6 years of experience, I bring to the table captivating and informative writing in the world news category. My expertise covers a range of industries, including tourism, technology, forex and stocks. From brief social media posts to in-depth articles, I am dedicated to creating compelling content for various platforms.


 meeting for peace: “First step towards reconciliation”")

