
- USD/JPY is steadily advancing around 0.28% amid a subdued session.
- The weekly chart shows the pair in overbought conditions, opening the door for a pullback.
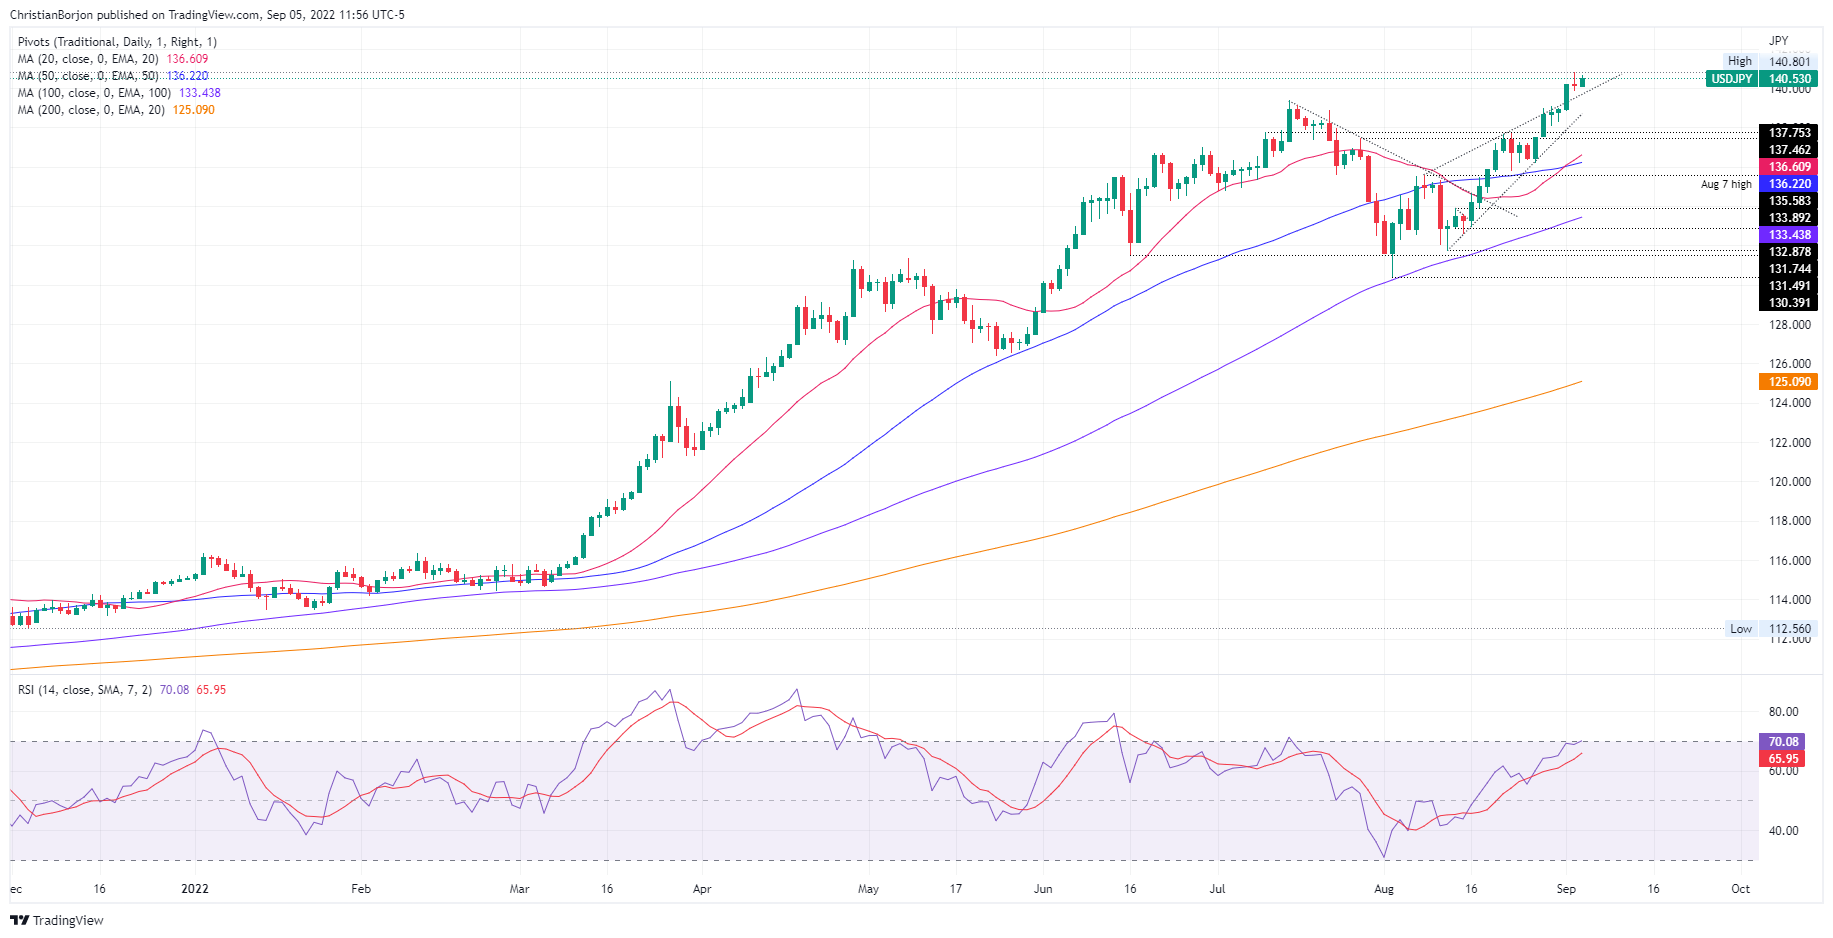
- On the daily chart, USD/JPY shows the balance between buyers and sellers, which suggests that the pair is consolidating in a range.
The USD/JPY is posting solid gains during the American session amid illiquid trading conditions as Wall Street is closed in observance of US Labor Day. USD/JPY is trading at 140.53, at the time of writing, after revisiting 24-year highs on Friday at 140.80.
USD/JPY Price Analysis: Technical Outlook
From a weekly chart perspective, USD/JPY continues to trend higher, but overbought conditions are beginning to be present. After refreshing all-time highs during May, July and September, with highs at 131.34, 139.38 and 140.80, respectively, the Relative Strength Index (RSI) reached 88, 84 and 72. Therefore, buying pressure could be easing. because traders refrain from opening new purchases, along with taking profits.
The daily chart of USD/JPY shows the pair breaking above the uptrend line, invalidating the bearish bias of the pattern. However, Friday’s USD/JPY price action formed a doji, meaning buyers and sellers are in balance, spurred on by rumors of Japanese authorities intervening in the forex market due to perceived weakness. of the yen. Therefore, the major could consolidate in the range of 139.00-140.00.
The first resistance for USD/JPY would be the all-time high at 140.80. A break above will expose the psychological level at 141.00 before testing the 24-year highs at 147.67. On the other hand, the first support of the USD/JPY would be the 140.00 level. Once broken, the next support would be the daily low of September 1 at 138.83, followed by 138.00.
Key USD/JPY Technical Levels
Source: Fx Street
With 6 years of experience, I bring to the table captivating and informative writing in the world news category. My expertise covers a range of industries, including tourism, technology, forex and stocks. From brief social media posts to in-depth articles, I am dedicated to creating compelling content for various platforms.


