
- USD/JPY hits a multi-year peak at 160.83, breaking above the key 160.00 level amid USD strength.
- Technicals show a strong bullish trend with RSI overbought, buying momentum is strong.
- Resistance levels: 161.00, 162.00, 164.87 (Nov 1986 high), 178 (Apr 1986 high).
- Support found at 158.75 (June 24 low), Tenkan-Sen at 157.82, Senkou Span A at 157.53, Kijun-Sen at 157.24.
He USD/JPY spiked during the Wednesday session after the pair hit a 38-year high above the psychological figure of 160.00, seen as the line in the sand for Japanese authorities and the Japanese Yen to intervene in the currency space. However, the lack of action led US Dollar bulls to push the exchange rate higher, and at the time of writing, the pair was trading at 160.83, representing an increase of 0.73%.
USD/JPY Price Analysis: Technical Perspective
USD/JPY has a bullish bias and extended its gains beyond the psychological barrier of 160.00 for the second time since April 29, when the pair printed a yearly high of 160.32. This has revived fears that the Japanese authorities or the Bank of Japan (BoJ) could intervene to stop the depreciation of the Yen.
Momentum favors buyers, with the Relative Strength Index (RSI) in overbought conditions. However, due to the strength of the uptrend, most technicians use 80 as “extremely” overextended conditions.
Next resistance would be the psychological levels of 161.00, 162.00, and so on, before testing the November 1986 high of 164.87, followed by the April 1986 high of 178.
Conversely, if USD/JPY falls below 160.00, the first support would be the June 24 low of 158.75, followed by the Tenkan-Sen at 157.82. Once those levels are broken, the next stop would be the Senkou Span A at 157.53, and then the Kijun-Sen at 157.24.
USD/JPY Price Action – Daily Chart
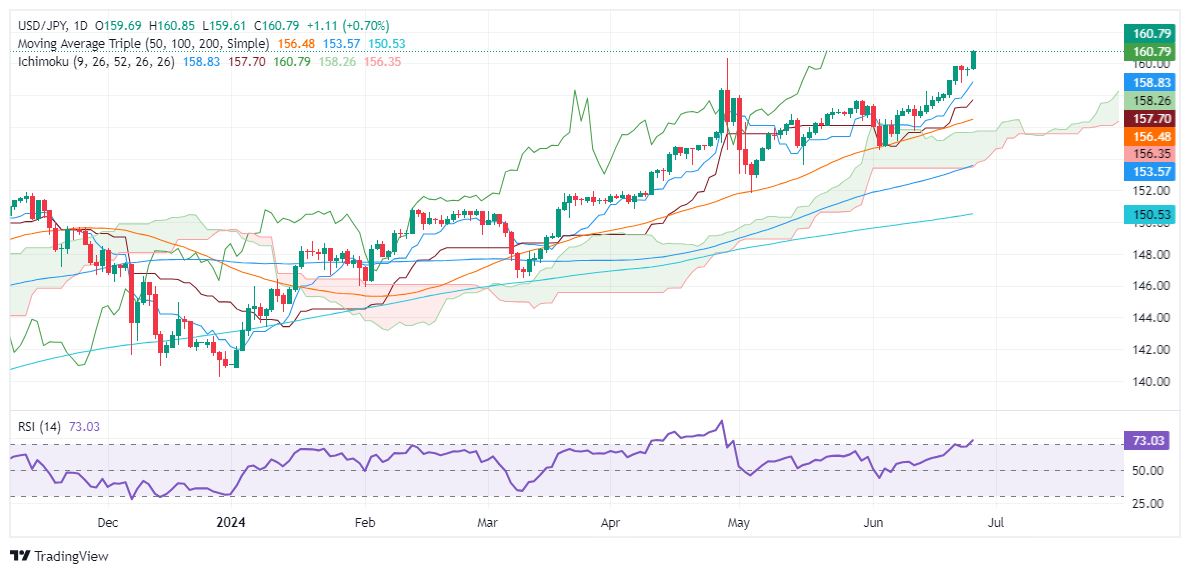
Source: Fx Street
I am Joshua Winder, a senior-level journalist and editor at World Stock Market. I specialize in covering news related to the stock market and economic trends. With more than 8 years of experience in this field, I have become an expert in financial reporting.


