
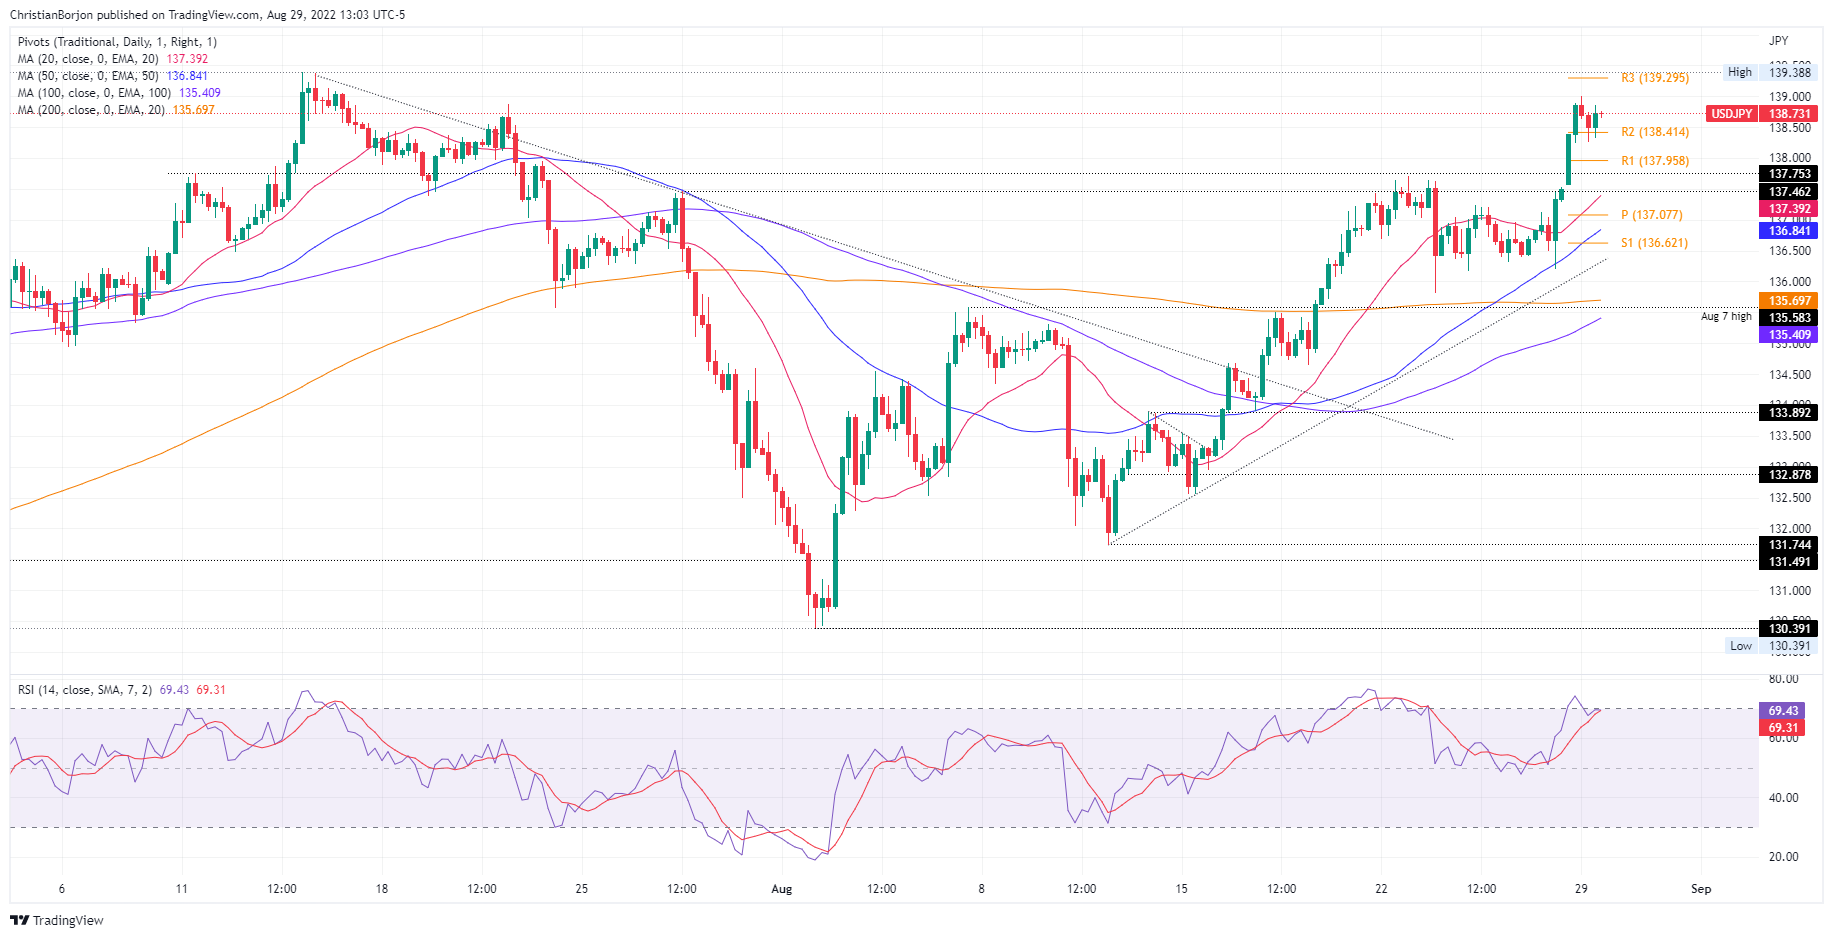
- USD/JPY hit a fresh 7-week high at 139.00.
- Once the 139.00 figure is broken, USD/JPY’s year-to-date high is at 139.38 as the pair heads towards 140.00.
The USD/JPY continued its rise, underpinned by rising US Treasury yields, on Monday, amid bearish sentiment fueled by Jerome Powell’s speech last Friday. He reiterated the Fed’s commitment to tackle inflation to the 2% target, despite causing slower economic growth, along with “pain for households and businesses.” At the time of writing, USD/JPY is trading at 138.73, above its opening price.
USD/JPY Price Analysis: Technical Outlook
Since the beginning of August, USD/JPY resumed its bullish bias after falling to fresh two-month lows at 130.39. It is worth noting that on its way to current exchange rates, the USD/JPY broke above both the 20 and 50-day EMAs, opening the door for further gains.
The bias is supported by the Relative Strength Index (RSI), which dipped below the 60 reading, turned 180 degrees and broke above the RSI 7-day SMA, showing that buyers they are gaining momentum.
In the short term, USD/JPY has a neutral bias to the upside, but when the RSI entered overbought conditions, USD/JPY pulled back from daily highs, reaching 139.00. However, the first resistance of the USD/JPY would be the figure of 139.00. Once broken, the next supply zone will be the year’s high at 139.38, followed by the key psychological level 140.00.
On the other hand, the first support for USD/JPY would be the R2 daily pivot at 138.41. If it breaks below, the next pivot levels will be exposed, such as the R1 at 137.95, followed by the 20 EMA at 137.39, before falling to the daily pivot at 137.07.
Technical levels
Source: Fx Street
With 6 years of experience, I bring to the table captivating and informative writing in the world news category. My expertise covers a range of industries, including tourism, technology, forex and stocks. From brief social media posts to in-depth articles, I am dedicated to creating compelling content for various platforms.


