- USD/JPY is trading firmly above 144.30, up 0.16%.
- During the week, USD/JPY has been unable to break the Bank of Japan line at 145.00.
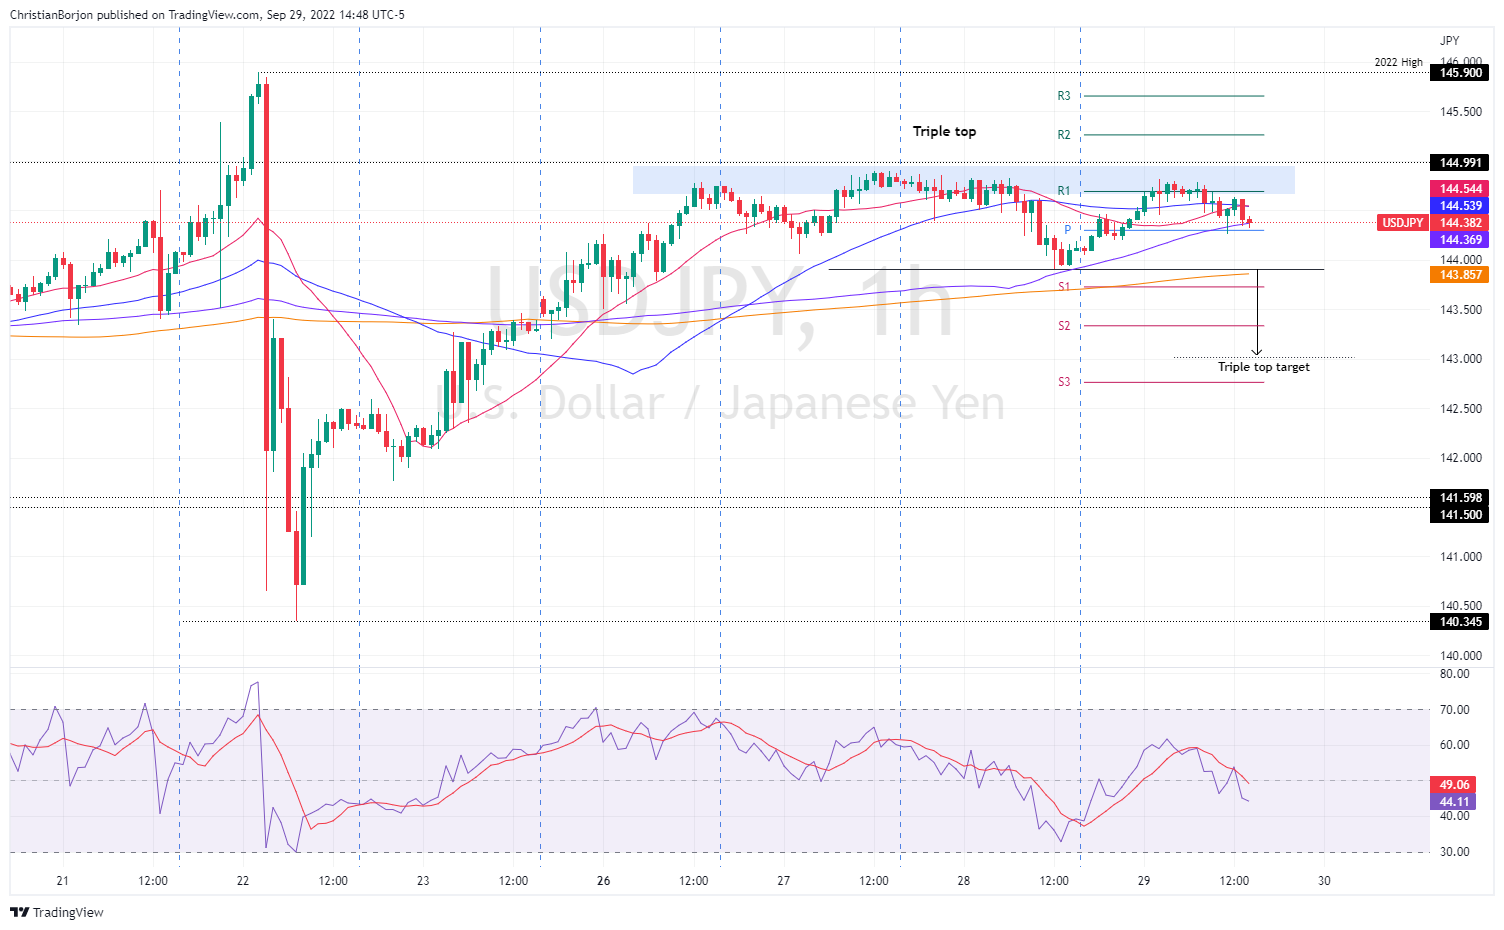
- The USD/JPY one hour chart shows the formation of a triple top, pointing to a drop towards 143.00.
USD/JPY is recovering on Thursday, following losses of 0.47% on Wednesday, thanks to falling US Treasury yields, which weighed on the dollar. However, fundamental factors such as the reiteration by US central bank officials of the need to raise rates to control inflation, strengthened USD/JPY. Therefore, USD/JPY is trading at 144.37, 0.18% higher from its opening price.
USD/JPY Price Analysis: Technical Outlook
USD/JPY has been unable to break above/below the Bank of Japan intervention on 22nd September in the FX markets, with price action remaining in the 140.34-145.90 range. Even though the weekly high has remained within ten points of the 145.00 figure, traders remain nervous about another Bank of Japan foray into the forex space. It is worth noting that USD/JPY is trading sideways while the Relative Strength Index (RSI) continues to head south. Therefore, the 20-day EMA at 143.27 is likely to be tested.
The one hour chart shows USD/JPY with a neutral to bearish bias. At the time of writing, the USD/JPY is testing the 100 EMA, which, once broken, could pave the way towards 143.90, the daily low of 28 Sep. Once broken, the next support would be the 200 EMA at 143.85, followed by the S1 daily pivot at 143.72, before the triple top target at 143.00.
Conversely, if USD/JPY breaks above 145.00, a retest of the yearly high at 145.90 is expected, unless the Japanese authorities re-enter the markets.

Key USD/JPY Technical Levels
USD/JPY
| Overview | |
|---|---|
| last price today | 144.38 |
| Today I change daily | 0.16 |
| Today’s daily variation in % | 0.11 |
| Daily opening today | 144.22 |
| Trends | |
|---|---|
| daily SMA20 | 143.07 |
| daily SMA50 | 138.52 |
| daily SMA100 | 135.88 |
| daily SMA200 | 127.67 |
| levels | |
|---|---|
| Previous daily high | 144.87 |
| Previous Daily Low | 143.91 |
| Previous Weekly High | 145.9 |
| Previous Weekly Low | 140.35 |
| Previous Monthly High | 139.08 |
| Previous Monthly Low | 130.4 |
| Daily Fibonacci of 38.2% | 144.28 |
| Daily Fibonacci of 61.8% | 144.5 |
| Daily Pivot Point S1 | 143.79 |
| Daily Pivot Point S2 | 143.37 |
| Daily Pivot Point S3 | 142.83 |
| Daily Pivot Point R1 | 144.76 |
| Daily Pivot Point R2 | 145.3 |
| Daily Pivot Point R3 | 145.72 |
Source: Fx Street
With 6 years of experience, I bring to the table captivating and informative writing in the world news category. My expertise covers a range of industries, including tourism, technology, forex and stocks. From brief social media posts to in-depth articles, I am dedicated to creating compelling content for various platforms.


