
- USD/JPY rose 0.17% driven by US producer price data suggesting the possibility of the Fed keeping interest rates high.
- Technical data: Six days of increases, with strong bullish momentum above the Ichimoku Cloud.
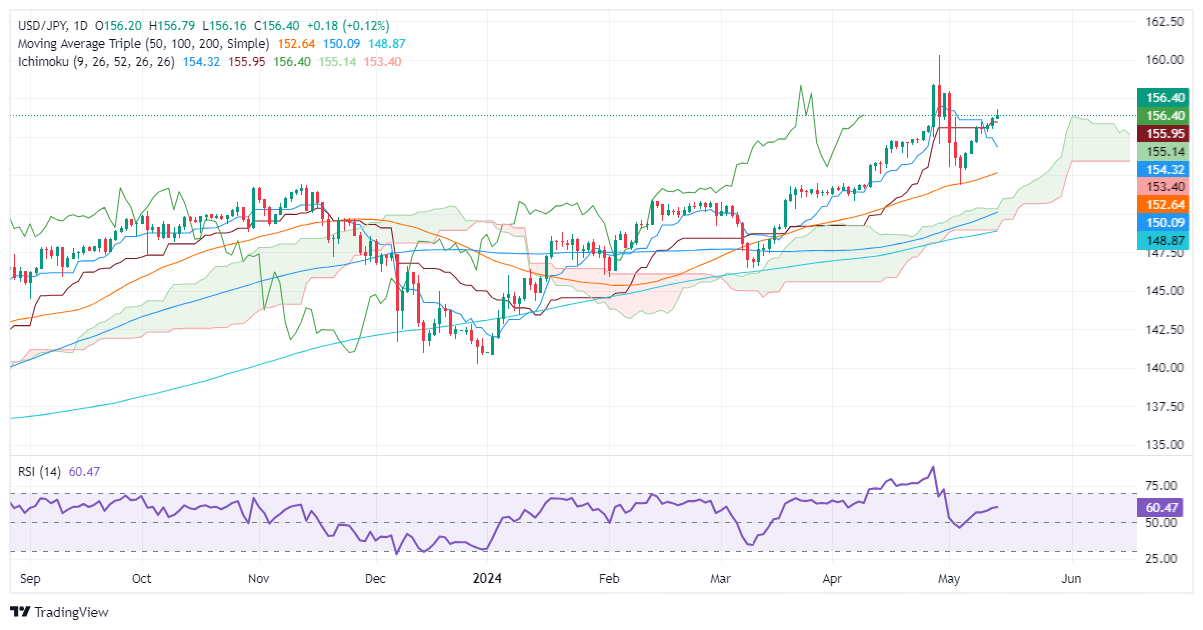
- Resistance is located at 157.00, then the high of May 1 at 157.98 and the high of April 26 at 158.44.
- Support is seen at 156.00, 155.90 (Kijun-Sen) and 155.10 (Senkou Span A).
USD/JPY rose during the North American session after inflation data in the United States (US) showed producer prices rose more than expected. This suggests the Fed could keep rates higher for longer amid fears that consumer inflation will reaccelerate. The pair is trading at 156.48, up 0.17% on the day.
USD/JPY Price Analysis: Technical Outlook
USD/JPY extended its gains for the sixth consecutive day, reigniting fears that Japanese authorities could intervene in currency markets. The momentum indicator remains tilted upward as price action remains above the Ichimoku (Kumo) Cloud. At the same time, the RSI trends are bullish, which could open the door to retesting the yearly highs.
If buyers reclaim the 157.00 figure, it would open the door to challenging the May 1 high at 157.98. Once broken, key resistance levels appear, such as the April 26 high at 158.44, followed by the April 29 high at 160.22.
On the other hand, if sellers drag prices below 156.00, further losses will occur. The next support would be the Kijun-Sen at 155.90. If the pair were to extend its downtrend, the next demand zone would be the Senkou Span A at 155.10 before sellers challenge the Tenkan-Sen at 154.31.
USD/JPY Price Action – Daily Chart
Source: Fx Street
I am Joshua Winder, a senior-level journalist and editor at World Stock Market. I specialize in covering news related to the stock market and economic trends. With more than 8 years of experience in this field, I have become an expert in financial reporting.


