
- USD/JPY is up nearly 1.50% for the week.
- A bullish candlestick pattern on the daily chart opens the door for further gains.
- In the short term, a pullback towards 134.00 is expected.
The USD/JPY rises for the third time during the week, reaching a new weekly high at 135.50, spurred on by positive US employment data released on Friday, which triggered a sharp reaction of almost 200 pips, from around 133.07 to its mentioned weekly max. At 135.06, the USD/JPY gains 1.66%.
USD/JPY Price Analysis: Technical Outlook
The USD/JPY price action on Friday shows that the major has formed a huge bullish engulfing candlestick pattern, which means that buying pressure is stepping in. At the same time, the exchange rate is trading above the 50-day EMA at 134.84, which, if broken decisively, could pave the way towards the 20-day EMA at 136.04. Notably, buyers are gaining momentum as the Relative Strength Index (RSI) shows, poised to cross the 50 center line, another reason for sellers to pull away once buyers have regained control.
Therefore, the first resistance for USD/JPY would be the 135.00 level, followed by the 20-day EMA at 136.04, and then the daily high of June 22 at 136.71.
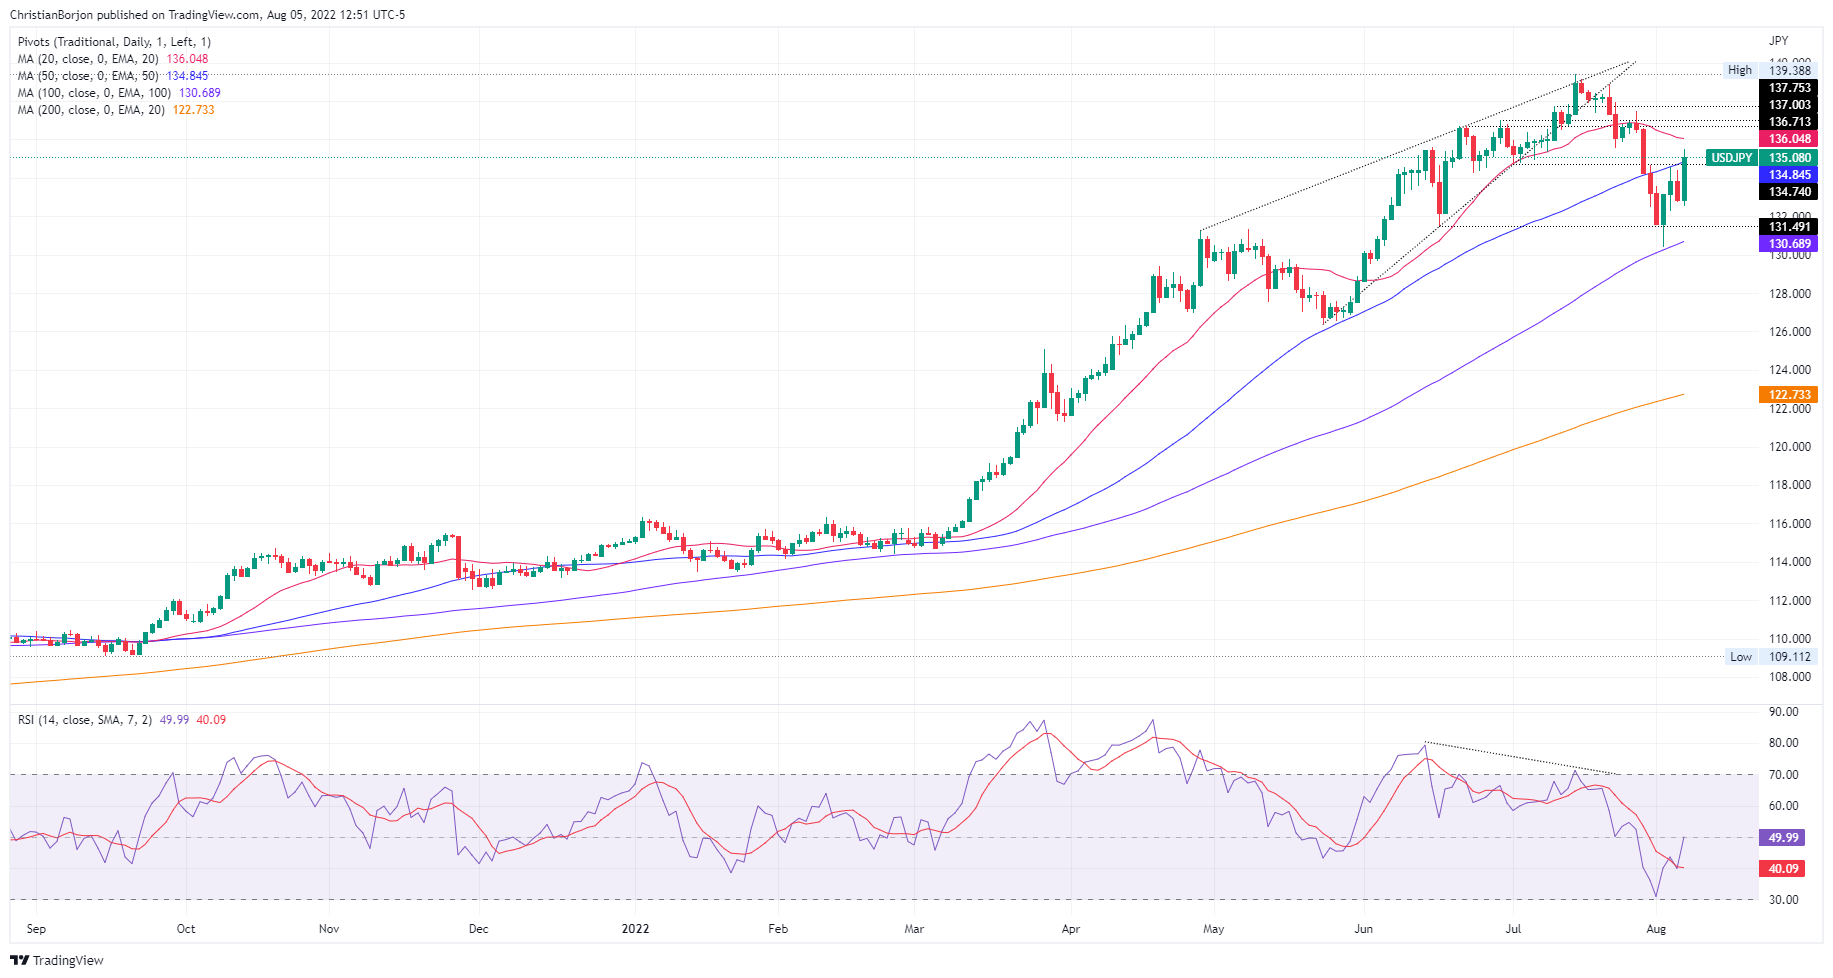
USD/JPY daily chart
Meanwhile, the hourly chart of USD/JPY illustrates the main resistance faced near the R3 pivot at 135.60, which falls towards the R2 daily pivot point at 135.00, where offers keep the pair above the 135.00 figure. However, the uptrend appears to be running out of steam as the Relative Strength Index reached overbought territory meaning buying pressure is easing, so a pullback to the R1 daily pivot around 133.94 it’s in the cards.
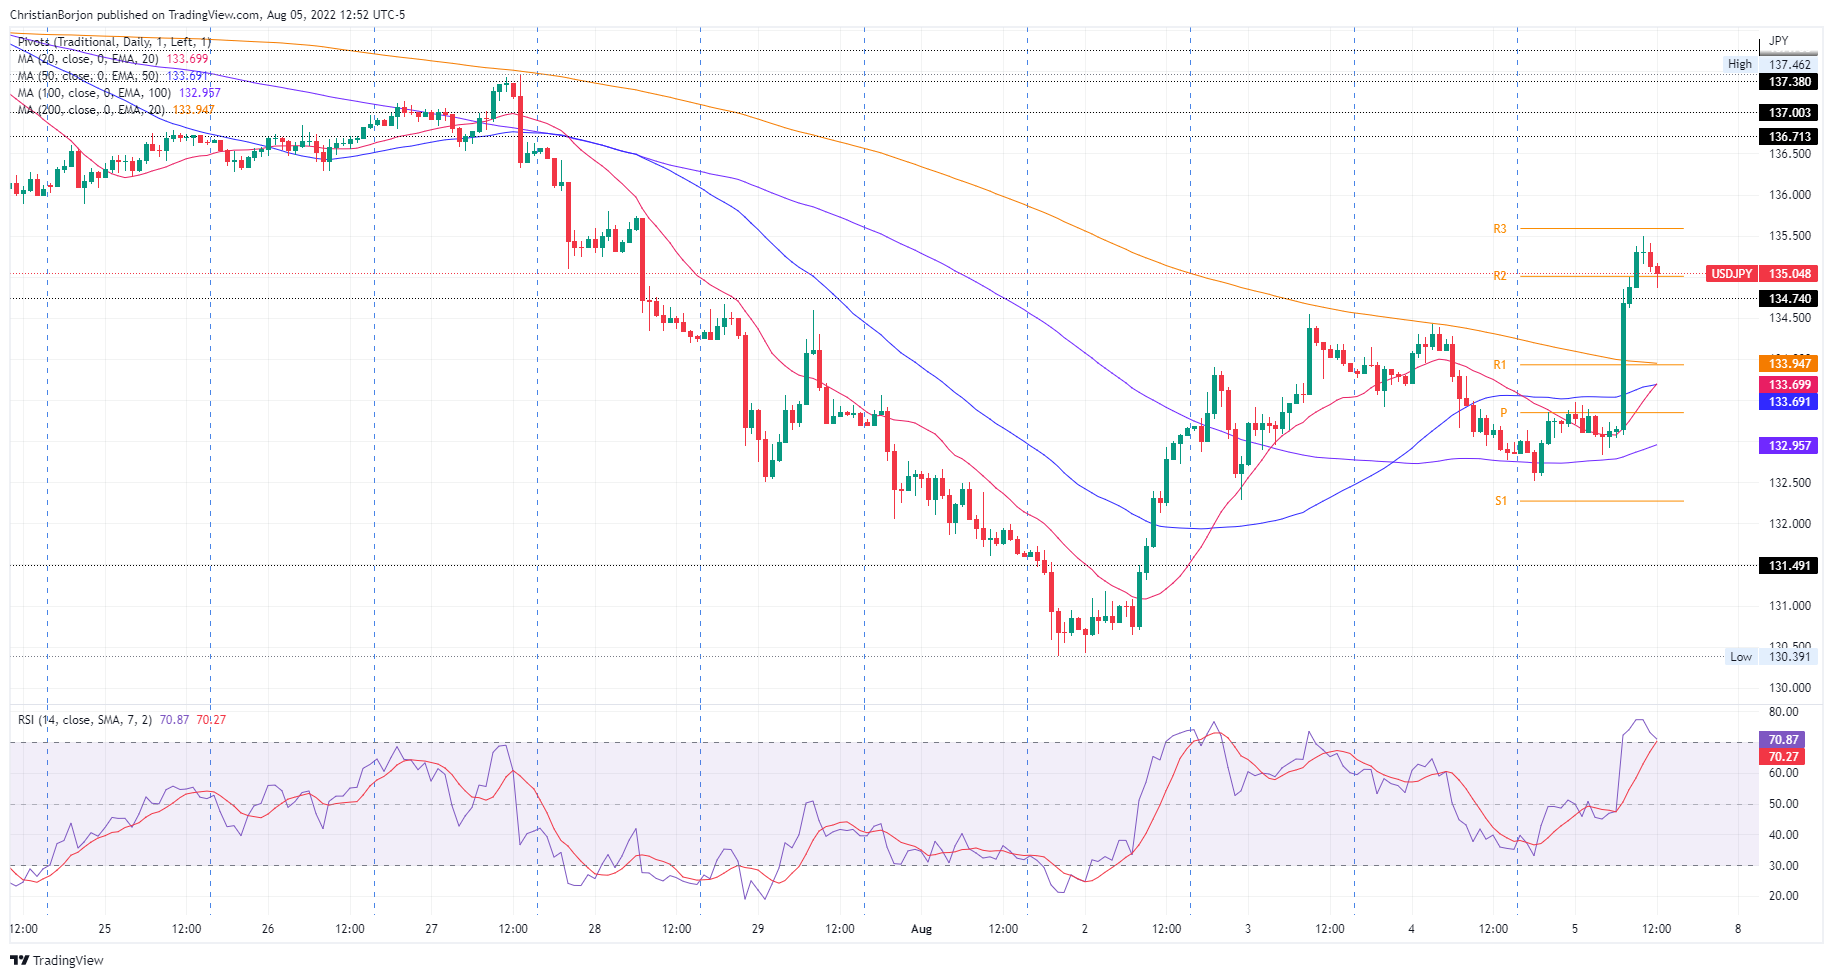
USD/JPY chart
Technical levels
Source: Fx Street
With 6 years of experience, I bring to the table captivating and informative writing in the world news category. My expertise covers a range of industries, including tourism, technology, forex and stocks. From brief social media posts to in-depth articles, I am dedicated to creating compelling content for various platforms.


