
- USD/JPY rises more than 0.60% from two-week low as positive sentiment reduces yen's safe-haven appeal.
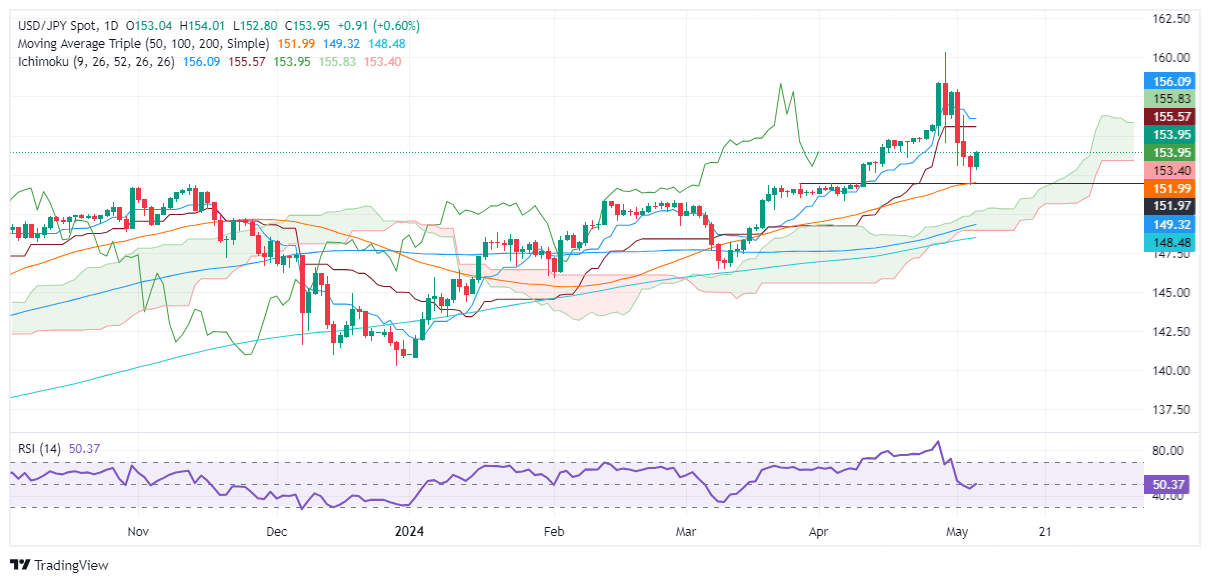
- Friday's candlestick at 152.97 indicates possible bullish momentum.
- Resistance is at 154.00, with targets at 155.52 (Tenkan-Sen) and 155.78 (Senkou Span A).
USD/JPY rebounded from a two-week low and rose towards the 153.90 area, far from clearing the 154.00 level decisively. It is trading with profits greater than 0.60%. Market sentiment is optimistic, a headwind for safe-haven currencies like the Japanese Yen (JPY).
USD/JPY Price Analysis: Technical Outlook
The USD/JPY pair remains biased higher. On Friday, the pair hit a two-week low at 151.99, although it ended the session at 152.97, forming a “hammer”, a candlestick chart pattern. This chart pattern is bullish when it is preceded by a downtrend, but it must be followed by a candle that surpasses the “hammer” high.
That said, USD/JPY surpassed the May 3 high at 153.80, opening the door for further rises. Therefore, the first resistance would be the 154.00 level. Once passed, the next level would be the Tenkan-Sen at 155.52, followed by the Senkou Span A at 155.78. New rises are expected at 156.05.
For a bearish resumption, sellers must overcome the 50-DMA at 151.99, which could pave the way to test the next low at 150.81.
USD/JPY Price Action – Daily Chart
Source: Fx Street
I am Joshua Winder, a senior-level journalist and editor at World Stock Market. I specialize in covering news related to the stock market and economic trends. With more than 8 years of experience in this field, I have become an expert in financial reporting.


