
- USD/JPY is trapped between the 50 and 100 day EMAs, waiting for a catalyst.
- In the short term, USD/JPY is neutral to the downside and could head lower if the 132.87 level is broken; Otherwise, a test of the 200 hourly EMA at 133.88 is expected.
USD/JPY is slightly in the negative territory in the early hours of the New York session, although it remains above its daily low reached at 132.55, as the bulls managed to defend last Friday’s daily low at 132.87, raising to the pair above the threshold of 133.00. At the time of writing, USD/JPY is trading at 133.15.
USD/JPY Price Analysis: Technical Outlook
USD/JPY is trading within the limits of the 50-day EMA and the 100-day EMA on both ends, located at 135.31 and 131.41, respectively. Although the Relative Strength Index (RSI) shows that the sellers are in command, the buyers are gaining momentum, lifting the RSI from its August lows near oversold conditions, about to retake the 50 midline.
Reviewing the pair from the 1 hour scale, indecision dominates the game. USD/JPY has been oscillating in the 132.85-133.90 range, although in the last two days, the successive series of higher highs and lower lows could open the door for further declines. If USD/JPY sellers break below 132.87, the next support will be the Aug 11 low at 131.73. Once broken, the next support would be at 131.00.
On the other hand, the first resistance for USD/JPY will be the 20-hour EMA at 133.25. A breakout of this latter region will expose further resistance levels such as the 50 hourly EMA at 133.54, followed by the confluence of the 12th August high and the 200 hourly EMA at 133.88.
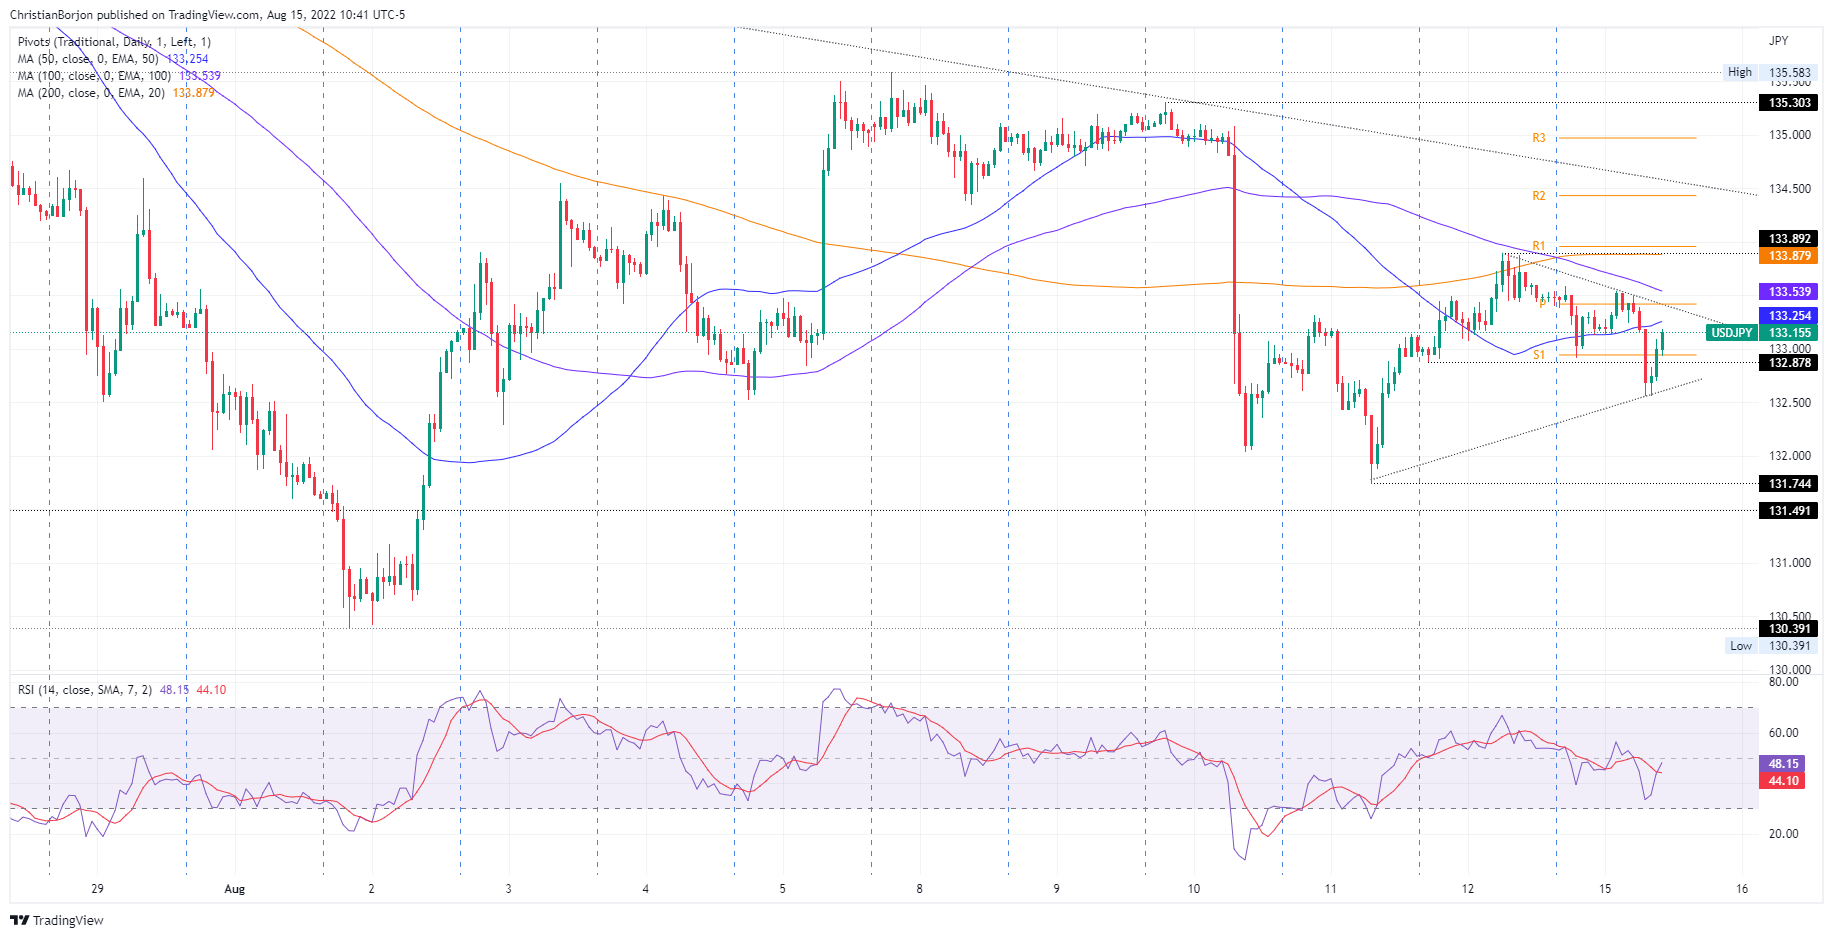 USD/JPY hourly chart
USD/JPY Key Technical Levels
Source: Fx Street
With 6 years of experience, I bring to the table captivating and informative writing in the world news category. My expertise covers a range of industries, including tourism, technology, forex and stocks. From brief social media posts to in-depth articles, I am dedicated to creating compelling content for various platforms.


