
- USD/JPY faces resistance at 156.50 as 10-year Treasury yields fall.
- Bullish technical outlook with decreasing momentum; an RSI below 50 could signal potential losses.
- Resistance levels sit at 156.76, 157.00 and the yearly high of 160.32.
- Key support lies at 156.00, Senkou Span A (155.61) and Kijun-Sen (155.18).
The USD/JPY pair faces resistance around 156.50 retreats while the US 10-year Treasury yield falls three and a half basis points, a headwind for the Dollar. The positive correlation between major currencies and the US 10-year Treasury yield weighed on the pair, which was down 0.06% and trading at 156.19.
USD/JPY Price Analysis: Technical Outlook
USD/JPY remains biased higher, but buyers appear to have lost some momentum. They are still unable to push the pair higher and challenge the last cycle high of 156.76, the May 14 high. The RSI suggests that buying pressure is moderating. Despite being in bullish territory, if the RSI breaks below the 50 midline, it could pave the way for USD/JPY losses.
For a bullish continuation, the first resistance of USD/JPY would be 156.76, followed by 157.00. The next level would be the May 1 high at 157.98, before challenging the yearly high of 160.32.
On the opposite side, and the more likely short-term path, if USD/JPY falls below 156.00, first support would be the Senkou Span A at 155.61. Once passed, the next stop would be the Senkou Span A at 155.61. Once overcome, the next support would be Kijun-Sen at 155.18 before 155.00.
USD/JPY Price Action – Daily Chart
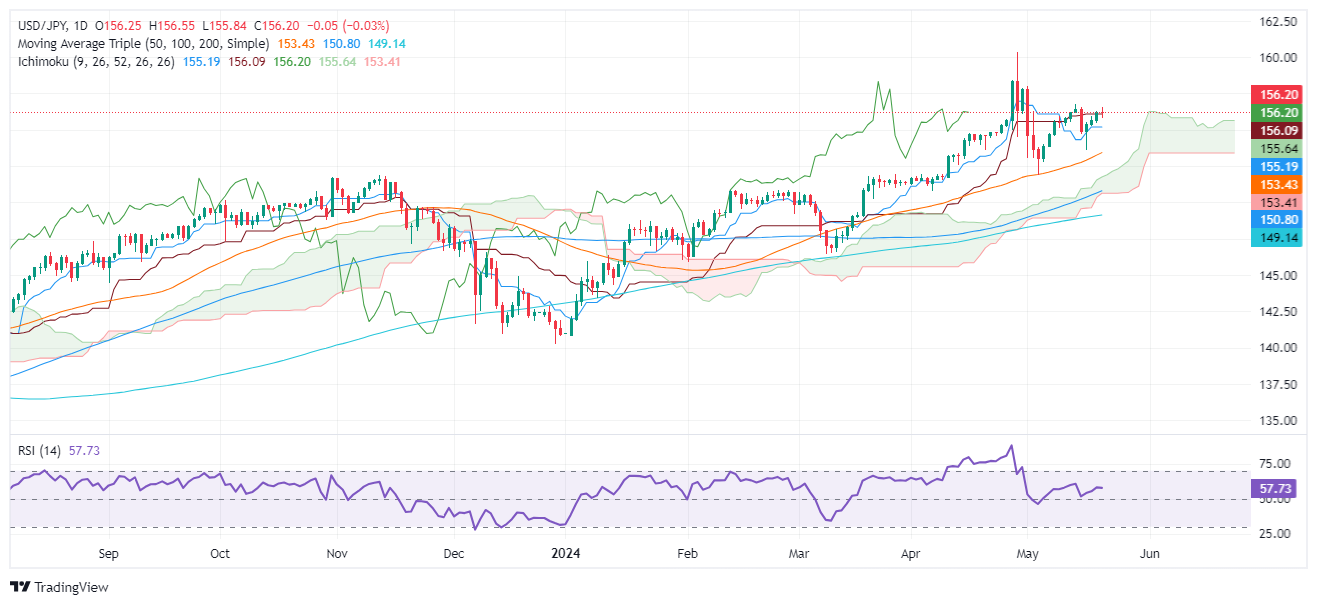
Source: Fx Street
I am Joshua Winder, a senior-level journalist and editor at World Stock Market. I specialize in covering news related to the stock market and economic trends. With more than 8 years of experience in this field, I have become an expert in financial reporting.


