
- The USD/JPY is trading stable around 149.70, with a slight advance of 0.14%.
- Concern about possible intervention by the Japanese authorities limits the increases.
- Rising US Treasury yields provide support to the pair.
USD/JPY remains stable around 149.70, limited to the upside by fear of threats of intervention by the Japanese authorities. Rising US Treasury yields supported the pair, although it continues to trade below 150.00, with minuscule gains of 0.14%.
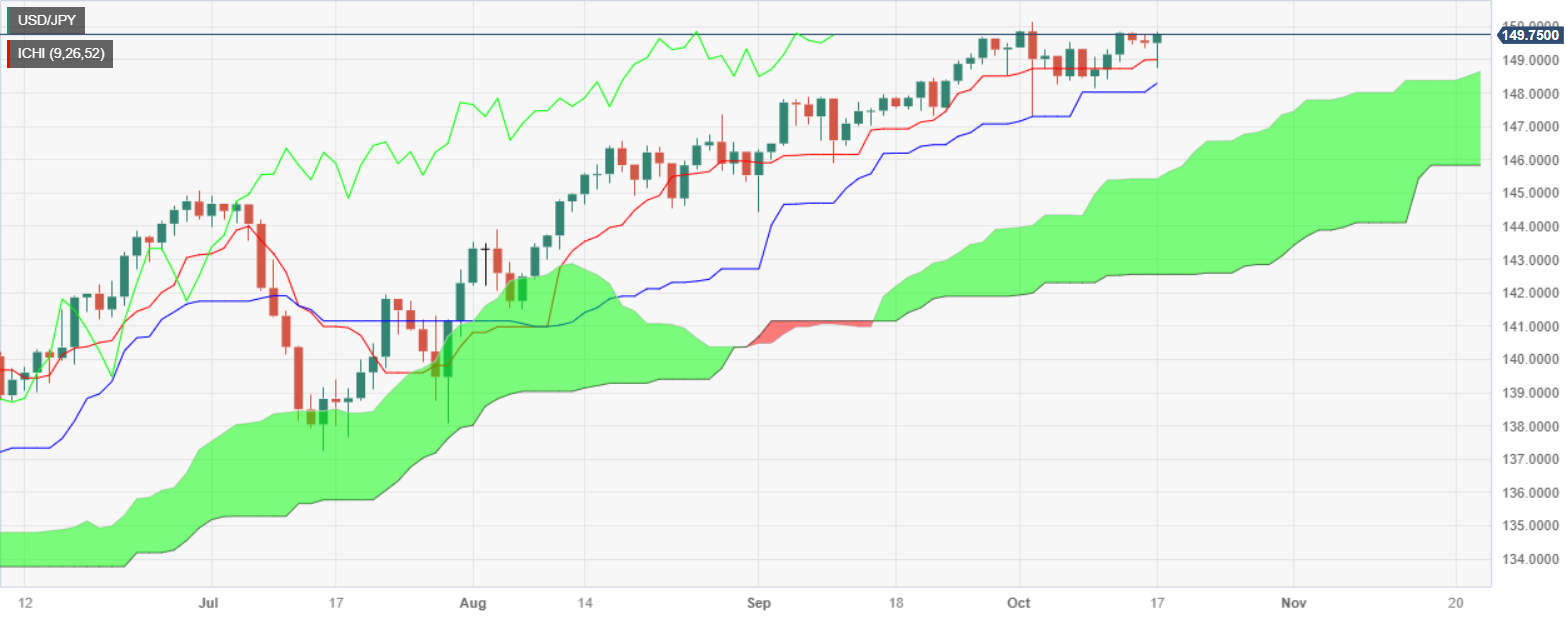
The Pair consolidates within the 149.00/150.00 signal, unable to break below/above the range decisively. However, if USD/JPY targets above 150.00, the next resistance would be the year-to-date high at 150.16, followed by the last year-to-date high at 151.94.
On the contrary, if USD/JPY falls below 149.00, the first support would be the Kijun-Sen line at 148.29. If the pair falls below this level, the next level would be the October 3 low at 147.37.
USD/JPY Price Action – Daily Chart
Key technical levels for USD/JPY
Source: Fx Street
I am Joshua Winder, a senior-level journalist and editor at World Stock Market. I specialize in covering news related to the stock market and economic trends. With more than 8 years of experience in this field, I have become an expert in financial reporting.


