
- USD/JPY is picking up some ground as traders prepare for a busy US economic calendar.
- Buyers are watching for a test of the 20-day EMA as the RSI and RoC suggest that USD/JPY could provide short-term momentum.
- SUD/JPY Price Analysis: Still biased to the downside, but could point to the upside.
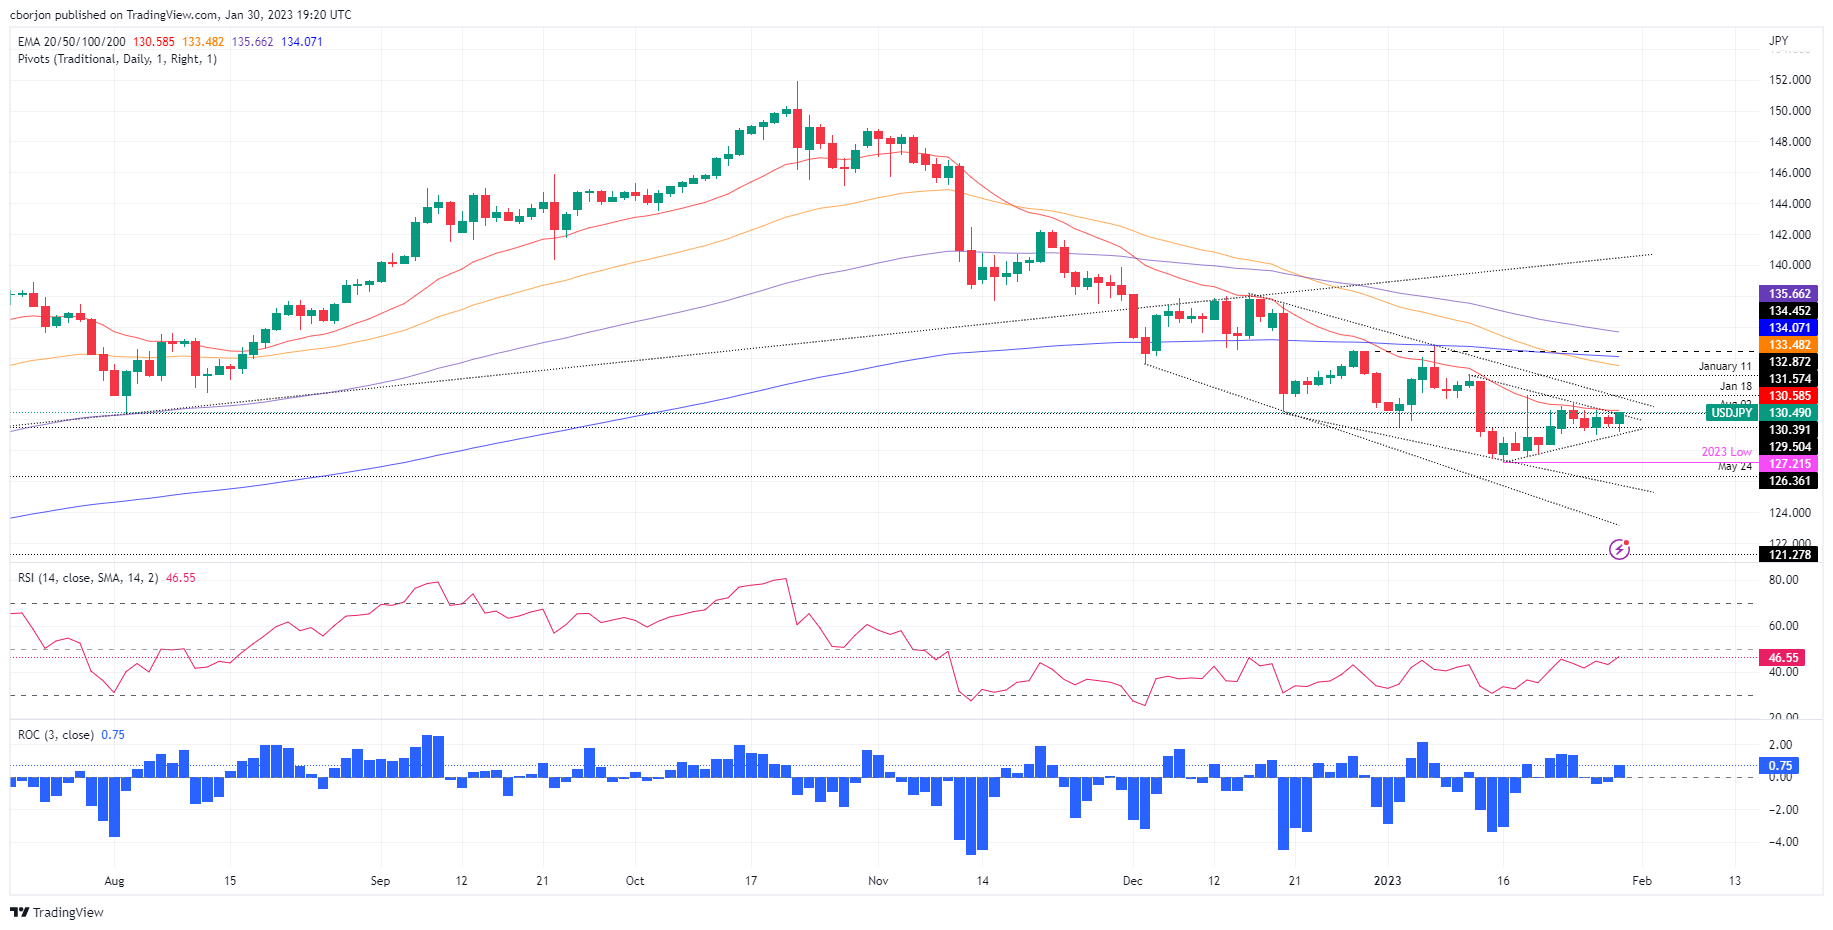
USD/JPY erases last Friday’s losses and hits a fresh session high at 130.49, albeit slightly below the 20-day EMA, used as a short-term trend barometer, which is holding for above the exchange rate. Therefore, USD/JPY remains bearish despite trading at 130.49, up 0.56% on the day.
USD/JPY Price Analysis: Technical Perspective
From a price action standpoint, USD/JPY remains bearish, despite trading at fresh daily highs. However, USD/JPY buyers need to break above the 20-day EMA at 130.57 to open the door for further gains. The Rate of Change (RoC) shows the buyer gaining momentum while the Relative Strength Index (RSI) is about to turn bullish, suggesting that bullish pressure is building.
Therefore, the first resistance for USD/JPY would be the 131.00 figure. A break of the latter would expose a month-old downtrend line around 131.330-40, followed by the Jan 18 daily high at 131.57, and then the Jan 11 swing high.
As an alternative scenario, if USD/JPY falls below 130.00, the next support would be the January 30 daily low at 129.19. A break of this latter level would expose the psychological level of 128.00, followed by the prior year low of 127.21.
USD/JPY Key Technical Levels
Source: Fx Street
I am Joshua Winder, a senior-level journalist and editor at World Stock Market. I specialize in covering news related to the stock market and economic trends. With more than 8 years of experience in this field, I have become an expert in financial reporting.


 meeting for peace: “First step towards reconciliation”")
