
- USD/JPY remains in the downtrend but is about to form a bullish Harami candlestick pattern, suggesting a bullish correction in the offing.
- USD/JPY Price Analysis: Once above 129.50, it could rally towards 131.57 before turning neutral.
The pair USD/JPY falls in a swing session of to below 130.00 after a round of US economic data suggesting the US Federal Reserve (Fed) may start raising rates in sizes of 25 basic points. Consequently, the Japanese yen (JPY) strengthened, sending the USD/JPY pair down 0.24%. At the time of writing, USD/JPY is trading at 129.92.
USD/JPY Price Analysis: Technical Perspective
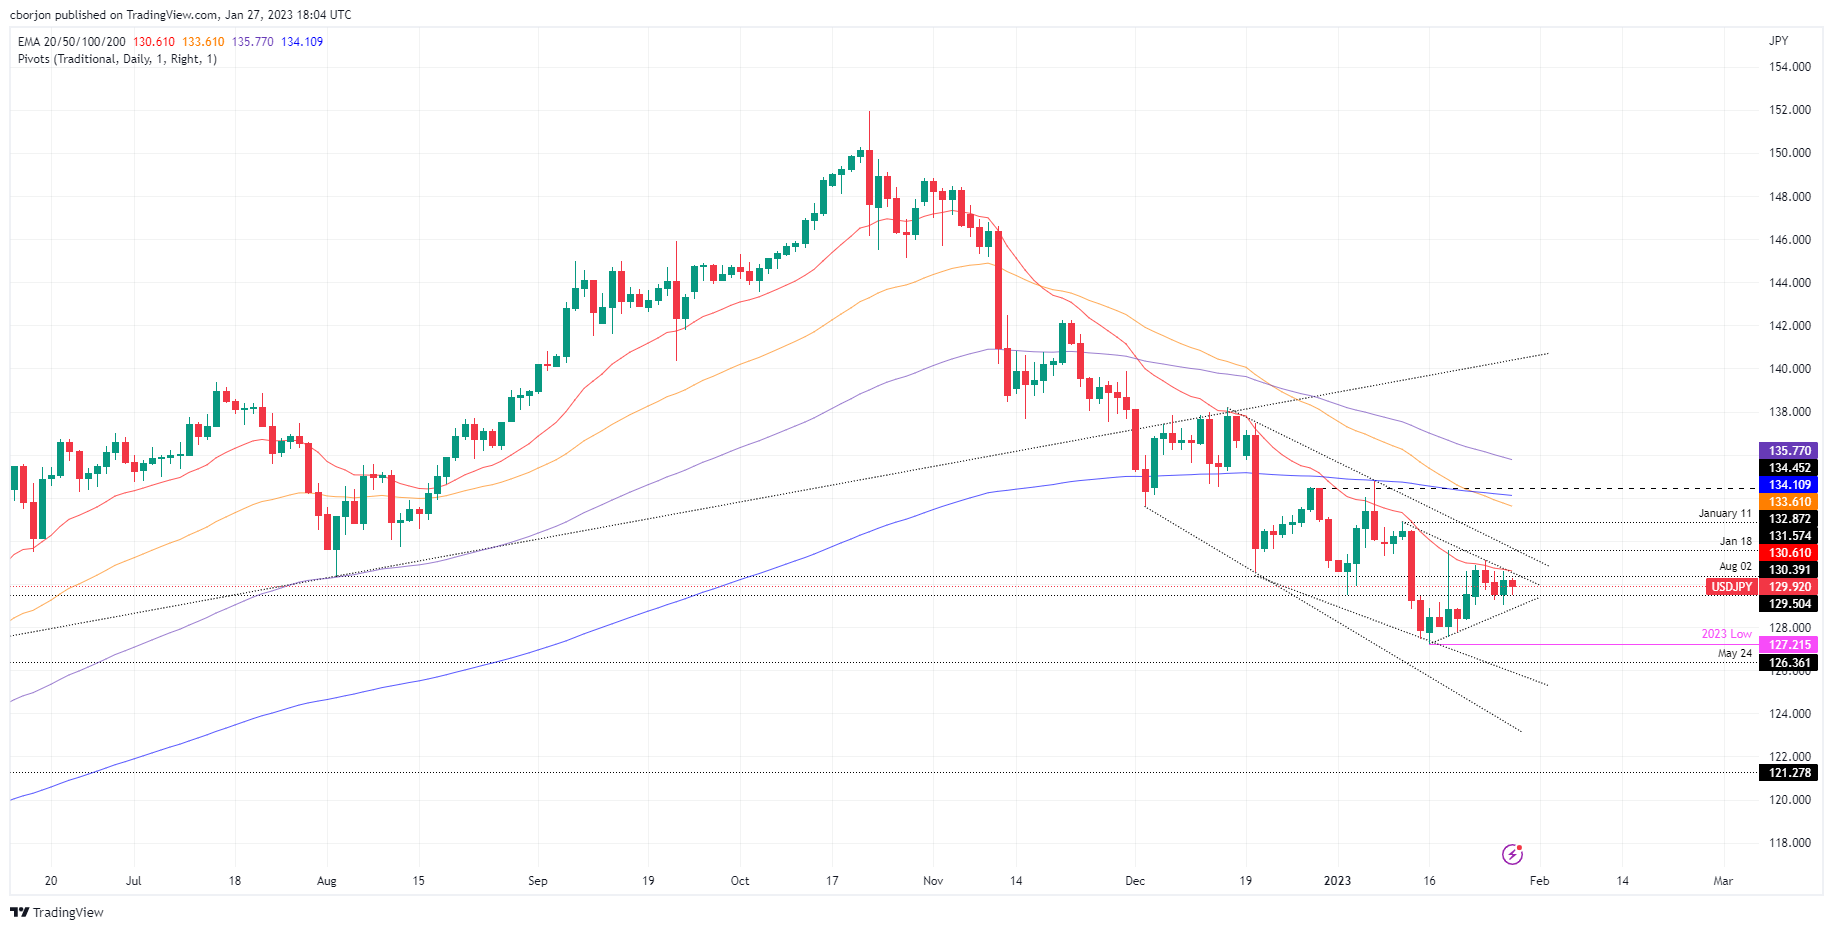
The USD/JPY pair remains biased to the downside, as the pair has held below the 20-day EMA at 130.60. Friday’s price action remains contained within the bounds of Thursday’s high and low, opening the door for a bullish harami candlestick formation, also known as an inside day in common bar chart lingo. Therefore, USD/JPY could rise before resuming its downtrend.
Therefore, the next resistance for USD/JPY would be 130.00, followed by the confluence of the 20 day EMA and a downtrend line around 130.60, which, once broken, could send USD/JPY higher towards the high of January 24 at 131.11. Breaking above will expose the January 18 high at 131.57.
As an alternative scenario, USD/JPY could fall towards 129.49, January 27 low. Once broken, the next support would be the weekly low of 129.02, followed by the low of 127.21.
Key technical levels for USD/JPY
Source: Fx Street
I am Joshua Winder, a senior-level journalist and editor at World Stock Market. I specialize in covering news related to the stock market and economic trends. With more than 8 years of experience in this field, I have become an expert in financial reporting.


