
- USD/JPY is trendless as investors await the Fed’s monetary policy decision.
- Sentiment remains bearish, keeping major currencies in choppy trading ranges.
- USD/JPY Price Analysis: USD/PY has a long-term bullish bias, but is in a range in the short term.
The USD/JPY remains low during the American session as investors brace for the Fed’s monetary policy decision due to be released on Wednesday, with traders expecting a 75 basis point hike in the interest rate. federal funds. On Tuesday, USD/JPY hit a daily low at 136.27. However, the pair rallied and reached a daily high around 136.84 before settling around 136.64 at the time of writing.
USD/JPY Price Analysis: Technical Outlook
From a technical point of view, USD/JPY has a long-term bullish bias. However, the sudden drop below the 20-day EMA at 136.85 makes the sellers hopeful of driving prices further down towards the rising band profit target at 133.50. On the other hand, if USD/JPY buyers achieve a daily close above 137.00, that would keep them in play to retest the year’s high at 139.38.
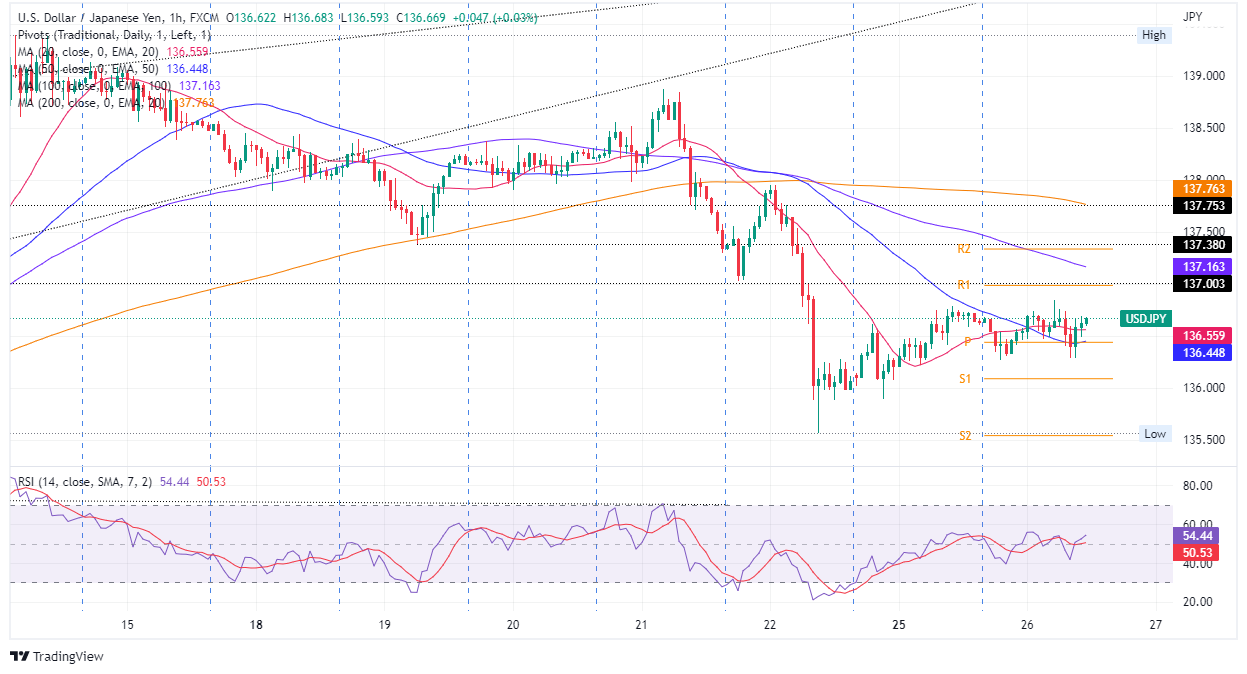
USD/JPY 1 hour chart
The USD/JPY hourly chart shows a neutral to bullish bias. The Relative Strength Index (RSI) hovers around the 50 midline, mirroring the above, as traders brace for the Fed. If USD/JPY breaks higher, first resistance would be the daily pivot R1 at 136.98. If it breaks above, the 100 hourly EMA will be exposed at 137.16, followed by the R2 pivot point at 137.33. On the other hand, the first support for USD/JPY would be the S1 pivot point at 136.08. Once broken, USD/JPY could drop towards the confluence of the Jul 22 low and the S2 daily pivot at 135.57.
Technical levels
Source: Fx Street
With 6 years of experience, I bring to the table captivating and informative writing in the world news category. My expertise covers a range of industries, including tourism, technology, forex and stocks. From brief social media posts to in-depth articles, I am dedicated to creating compelling content for various platforms.


