
- USD/JPY is selling off rapidly and is now likely in a short to medium term downtrend.
- The pair is likely to continue declining towards targets at the lows of 150.
- The RSI is oversold, which increases the risk of a correction or consolidation.
The USD/JPY is falling sharply from its early July highs. After peaking at 161.95 on July 3, it has fallen by more than 5 yen to 156.50 on July 17.
The break below the main trendline at 158.45 on July 13 was a game-changer for the pair and, coupled with the more recent break below the low of 157.15 on July 15, has given the chart a much more bearish look.
The short-term trend is bearish and the medium-term trend is now also likely negative. Given the old adage that “the trend is your friend”, the odds favor a continuation lower on those timeframes.
USD/JPY Daily Chart
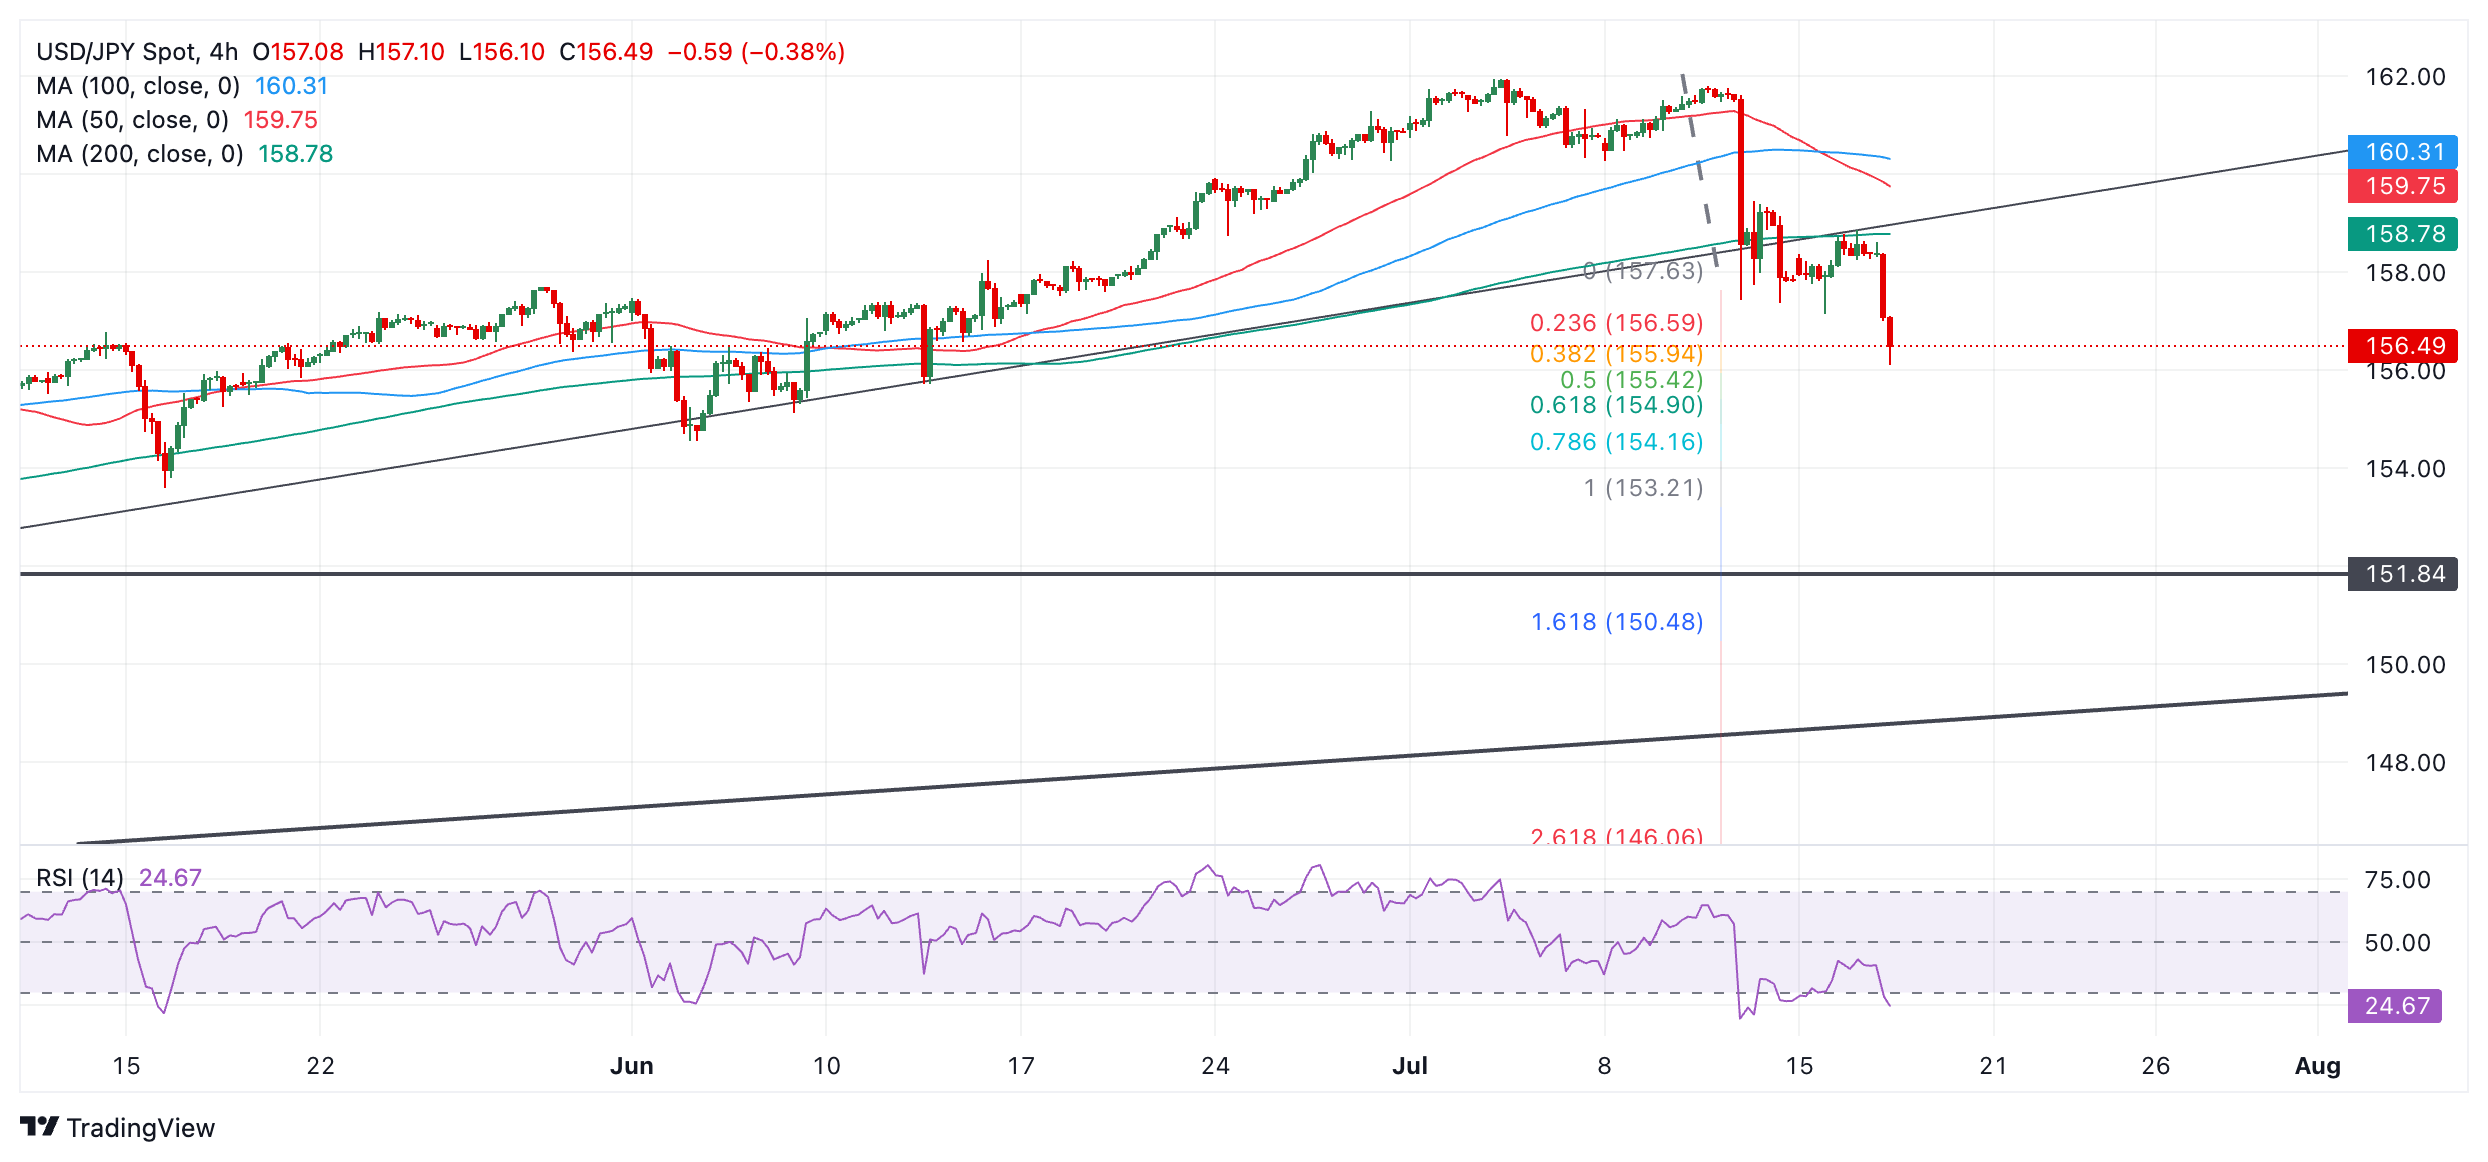
How much further could USD/JPY fall? The next immediate target is at 154.90, which is the 61.8% Fibonacci extension of the previous downside move prior to the trendline breakout extrapolated to the downside. This is followed by 153.21, the 100% extrapolation of the same.
A more bearish scenario could even see the price drop to 151.84 and a key support level (October 2021 high).
The RSI is in oversold territory, indicating a growing possibility of a pullback or consolidation that will delay the pair’s decline.
Source: Fx Street
I am Joshua Winder, a senior-level journalist and editor at World Stock Market. I specialize in covering news related to the stock market and economic trends. With more than 8 years of experience in this field, I have become an expert in financial reporting.


