
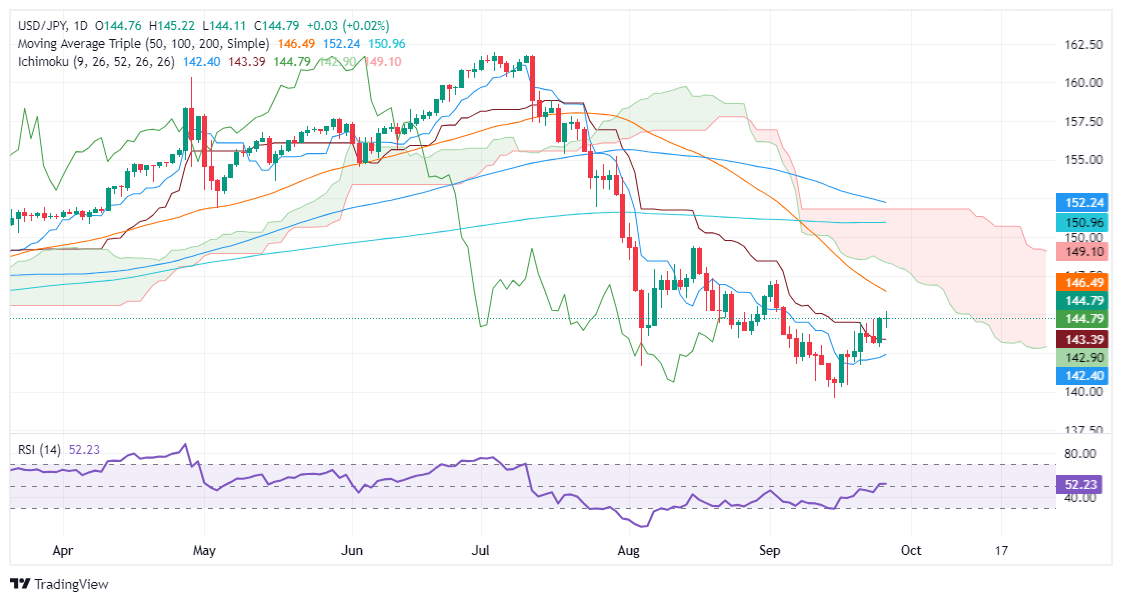
- USD/JPY is trading flat at 144.72 after hitting a three-week high of 145.21 as election uncertainty dampens momentum.
- The doji candle and flat RSI suggest indecision in the market, with key resistance at the 50-day moving average (DMA) of 146.49.
- A break below 144.11 could lead to further declines, testing support levels at 143.39 and 142.39.
USD/JPY remains contained after swinging within a 110 pip range, where the pair hit a three-week high of 145.21. Uncertainty around the Japanese election has overshadowed speeches by Bank of Japan (BoJ) officials, who decided to keep rates unchanged last week. At the time of writing, the main pair is trading flat at 144.72.
USD/JPY Price Forecast: Technical Outlook
From a technical point of view, the downtrend is destined to continue. Thursday’s price action forms a ‘doji’, meaning that neither buyers nor sellers are committing to strong positions. Even the Relative Strength Index (RSI), despite showing the bulls in charge, the RSI slope is flat at 51.
If USD/JPY buyers push prices above the September 26 high at 145.21, that could trigger a challenge to the 50-day moving average (DMA) at 146.49 before testing the 147.00 mark. The next resistance would be the bottom of the Ichimoku (Kumo) Cloud around 148.20-50.
Conversely, if the pair falls below the September 26 low of 144.11, that will test the Kijun-Sen at 143.39, followed by the Senkou Span A at 142.89. With further weakness, the Tenkan-Sen will be the last line of defense for the bulls at 142.39.
USD/JPY Price Action – Daily Chart
Japanese Yen PRICE Today
The table below shows the percentage change of the Japanese Yen (JPY) against major currencies today. Japanese Yen was the strongest currency against the Japanese Yen.
| USD | EUR | GBP | JPY | CAD | AUD | NZD | CHF | |
|---|---|---|---|---|---|---|---|---|
| USD | -0.38% | -0.65% | 0.01% | -0.06% | -1.00% | -1.00% | -0.51% | |
| EUR | 0.38% | -0.28% | 0.39% | 0.32% | -0.62% | -0.62% | -0.13% | |
| GBP | 0.65% | 0.28% | 0.66% | 0.60% | -0.34% | -0.36% | 0.15% | |
| JPY | -0.01% | -0.39% | -0.66% | -0.06% | -1.02% | -1.02% | -0.53% | |
| CAD | 0.06% | -0.32% | -0.60% | 0.06% | -0.93% | -0.94% | -0.44% | |
| AUD | 1.00% | 0.62% | 0.34% | 1.02% | 0.93% | 0.00% | 0.50% | |
| NZD | 1.00% | 0.62% | 0.36% | 1.02% | 0.94% | -0.00% | 0.50% | |
| CHF | 0.51% | 0.13% | -0.15% | 0.53% | 0.44% | -0.50% | -0.50% |
The heat map shows percentage changes for major currencies. The base currency is selected from the left column, while the quote currency is selected from the top row. For example, if you choose the Japanese Yen from the left column and move along the horizontal line to the US Dollar, the percentage change shown in the box will represent the JPY (base)/USD (quote).
Source: Fx Street
I am Joshua Winder, a senior-level journalist and editor at World Stock Market. I specialize in covering news related to the stock market and economic trends. With more than 8 years of experience in this field, I have become an expert in financial reporting.


