
- USD/JPY forms a bearish engulfing pattern, signaling a possible further decline in the near term.
- The RSI momentum supports the sellers, with the first support at the Tenkan-Sen 145.33 and the psychological level of 145.00.
- Bulls must reclaim the Kijun-Sen at 148.45, with 150.00 needed to reverse the downtrend.
The USD/JPY fell at the end of the North American session, posting losses of over 0.80% or more than 100 pips. It is now trading at 145.68.
During the overnight session for US traders, headlines revealed that Bank of Japan (BoJ) Governor Kazuo Ueda reiterated his hawkish stance in remarks presented to a government panel. This was the main driver of the pair, along with the fall in the yield on the 10-year US Treasury note.
USD/JPY Price Forecast: Technical Outlook
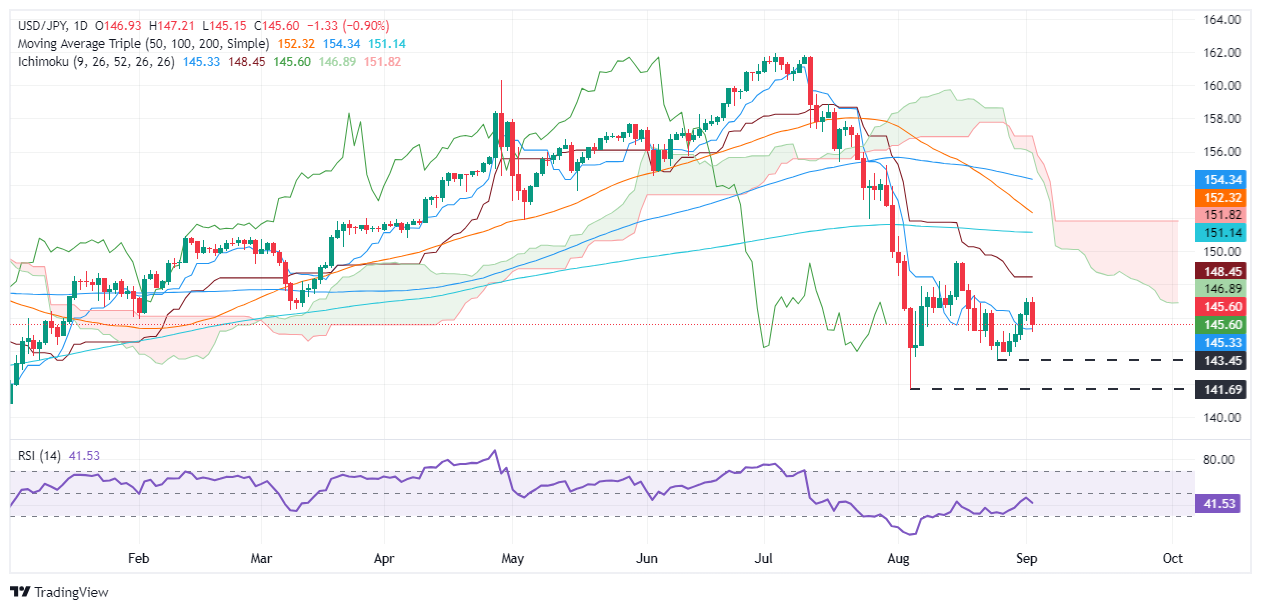
From a technical standpoint, the USD/JPY has a bearish bias, forming a ‘bearish engulfing’ chart pattern. This suggests that further downside is expected, which is further confirmed by the Relative Strength Index (RSI), which reaffirms that momentum supports the sellers.
With the path of least resistance tilted to the downside, the first support for the USD/JPY would be the Tenkan-Sen at 145.33. If overcome, the next stop would be the 145.00 figure, before testing the next cycle low of 143.45, the daily low of August 26. This would be the last line of defense for the bulls, before the August 5 low of 141.69.
For the bulls to regain control, they must reclaim the Kijun-Sen at 148.45 before reclaiming the 150.00 figure above the latest cycle high of 149.39.
USD/JPY Price Action – Daily Chart
Japanese Yen PRICE Today
The table below shows the Japanese Yen (JPY) exchange rate against major currencies today. The Japanese Yen was the strongest currency against the Australian Dollar.
| USD | EUR | GBP | JPY | CAD | AUD | NZD | CHF | |
|---|---|---|---|---|---|---|---|---|
| USD | 0.26% | 0.28% | -0.92% | 0.42% | 1.19% | 0.93% | -0.12% | |
| EUR | -0.26% | 0.00% | -1.16% | 0.14% | 0.91% | 0.55% | -0.39% | |
| GBP | -0.28% | -0.01% | -1.18% | 0.14% | 0.90% | 0.55% | -0.39% | |
| JPY | 0.92% | 1.16% | 1.18% | 1.32% | 2.10% | 1.67% | 0.77% | |
| CAD | -0.42% | -0.14% | -0.14% | -1.32% | 0.75% | 0.32% | -0.53% | |
| AUD | -1.19% | -0.91% | -0.90% | -2.10% | -0.75% | -0.46% | -1.29% | |
| NZD | -0.93% | -0.55% | -0.55% | -1.67% | -0.32% | 0.46% | -0.83% | |
| CHF | 0.12% | 0.39% | 0.39% | -0.77% | 0.53% | 1.29% | 0.83% |
The heatmap shows percentage changes of major currencies. The base currency is selected from the left column, while the quote currency is selected from the top row. For example, if you choose the Japanese Yen from the left column and move along the horizontal line to the US Dollar, the percentage change shown in the chart will represent the JPY (base)/USD (quote).
Source: Fx Street
I am Joshua Winder, a senior-level journalist and editor at World Stock Market. I specialize in covering news related to the stock market and economic trends. With more than 8 years of experience in this field, I have become an expert in financial reporting.


