
- USD/JPY is trading at 148.17 after hitting a low of 147.55, supported by buyers returning above the 148.00 level.
- The technical picture suggests upside potential with resistance at 149.14, followed by 149.39 and 150.00.
- A drop below the Ichimoku Cloud at 146.60-80 could signal further declines for the pair.
USD/JPY remains virtually unchanged after falling to a two-day low of 147.55 amid hopes of a ceasefire between Hezbollah and Israel, as stated by a prominent Hezbollah leader, according to CNN. At the time of writing, the pair is trading at 148.17, flat.
USD/JPY Price Forecast: Technical Overview
Although USD/JPY paused its upward trend, the pair resumed its advance.
The pair hit a weekly low of 147.34, but the entry of buyers pushed the exchange rate above the psychological figure of 148.00, opening the door for further gains.
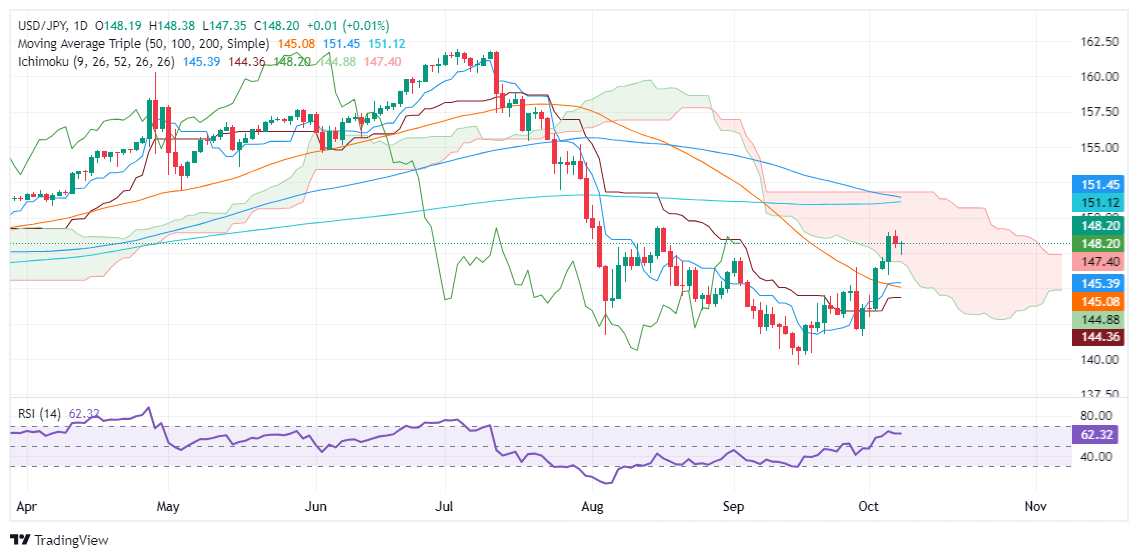
The Relative Strength Index (RSI) shows the bulls in charge, although it shows that the momentum has stopped.
For USD/JPY buyers to resume the uptrend, the first resistance will be the October 7 high at 149.14. A break of the latter will expose the August 15 high of 149.39, followed by the figure of 150.00. Once above those areas, buyers will target the 200-day moving average (DMA) at 151.13.
On the other hand, if USD/JPY falls below the Ichimoku (Kumo) Cloud at 146.60-80, this could pave the way for further declines.
USD/JPY Price Action – Daily Chart
Japanese Yen PRICE Today
The table below shows the percentage change of the Japanese Yen (JPY) against major currencies today. Japanese yen was the strongest currency against the Swiss franc.
| USD | EUR | GBP | JPY | CAD | AUD | NZD | CHF | |
|---|---|---|---|---|---|---|---|---|
| USD | -0.05% | -0.16% | 0.00% | 0.20% | 0.15% | -0.19% | 0.34% | |
| EUR | 0.05% | -0.11% | 0.07% | 0.25% | 0.20% | -0.16% | 0.38% | |
| GBP | 0.16% | 0.11% | 0.16% | 0.35% | 0.31% | -0.06% | 0.50% | |
| JPY | 0.00% | -0.07% | -0.16% | 0.31% | 0.14% | -0.21% | 0.34% | |
| CAD | -0.20% | -0.25% | -0.35% | -0.31% | -0.05% | -0.39% | 0.14% | |
| AUD | -0.15% | -0.20% | -0.31% | -0.14% | 0.05% | -0.36% | 0.21% | |
| NZD | 0.19% | 0.16% | 0.06% | 0.21% | 0.39% | 0.36% | 0.55% | |
| CHF | -0.34% | -0.38% | -0.50% | -0.34% | -0.14% | -0.21% | -0.55% |
The heat map shows percentage changes for major currencies. The base currency is selected from the left column, while the quote currency is selected from the top row. For example, if you choose the Japanese Yen from the left column and move along the horizontal line to the US Dollar, the percentage change shown in the box will represent the JPY (base)/USD (quote).
Source: Fx Street
I am Joshua Winder, a senior-level journalist and editor at World Stock Market. I specialize in covering news related to the stock market and economic trends. With more than 8 years of experience in this field, I have become an expert in financial reporting.


