
- USD/JPY retreats from a two-week peak of 144.68, dragged down by falling US Treasury yields.
- Technical indicators maintain a bearish stance with the pair below the Ichimoku Cloud and the 200-day SMA, suggesting further declines.
- Key supports identified at the September 20 low of 141.73 and the September 16 low of 139.58.
- For a bullish reversal, USD/JPY needs to clear the Kijun-Sen at 143.44, with further hurdles at 144.00 and the recent high of 144.68.
USD/JPY is retreating after hitting a two-week high of 144.68, sliding around 0.28%. The Dollar is being hit by worse-than-expected US data and falling US Treasury yields. This and investors’ pricing in a 50 basis point (bp) rate cut by the Fed undermined the pair, which is trading at 143.14.
USD/JPY Price Forecast: Technical Outlook
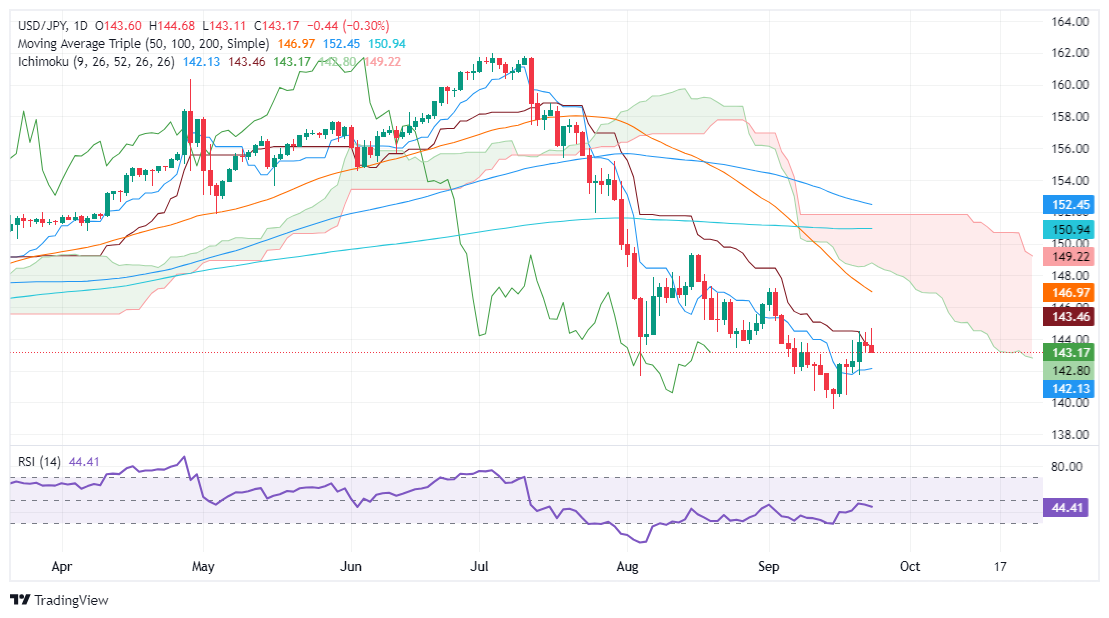
Despite testing the 144.00 figure for three consecutive trading days, the pair remains in a sustained downtrend. USD/JPY buyers failed to conquer the aforementioned price level, which led to a decline on Tuesday.
The Relative Strength Index (RSI) suggests that momentum favors sellers. USD/JPY remaining below the Ichimoku (Kumo) Cloud and the 200-day Moving Average (SMA) could pave the way for testing lower prices.
The next critical support level will be the September 20 low of 141.73, before falling to the September 16 low of 139.58.
Conversely, if USD/JPY heads towards the Kijun-Sen at 143.44 and breaks above that level, the pair could aim to challenge 144.00. Further upside is seen above the two-week high of 144.68.
USD/JPY Price Action – Daily Chart
Japanese Yen PRICE Today
The table below shows the Japanese Yen (JPY) exchange rate against major currencies today. The Japanese Yen was the strongest currency against the US Dollar.
| USD | EUR | GBP | JPY | CAD | AUD | NZD | CHF | |
|---|---|---|---|---|---|---|---|---|
| USD | -0.60% | -0.50% | -0.30% | -0.80% | -0.78% | -1.17% | -0.50% | |
| EUR | 0.60% | 0.10% | 0.29% | -0.24% | -0.18% | -0.59% | 0.09% | |
| GBP | 0.50% | -0.10% | 0.19% | -0.30% | -0.27% | -0.69% | 0.00% | |
| JPY | 0.30% | -0.29% | -0.19% | -0.48% | -0.49% | -0.89% | -0.20% | |
| CAD | 0.80% | 0.24% | 0.30% | 0.48% | 0.02% | -0.38% | 0.31% | |
| AUD | 0.78% | 0.18% | 0.27% | 0.49% | -0.02% | -0.39% | 0.29% | |
| NZD | 1.17% | 0.59% | 0.69% | 0.89% | 0.38% | 0.39% | 0.70% | |
| CHF | 0.50% | -0.09% | -0.01% | 0.20% | -0.31% | -0.29% | -0.70% |
The heatmap shows percentage changes of major currencies. The base currency is selected from the left column, while the quote currency is selected from the top row. For example, if you choose the Japanese Yen from the left column and move along the horizontal line to the US Dollar, the percentage change shown in the chart will represent the JPY (base)/USD (quote).
Source: Fx Street
I am Joshua Winder, a senior-level journalist and editor at World Stock Market. I specialize in covering news related to the stock market and economic trends. With more than 8 years of experience in this field, I have become an expert in financial reporting.


