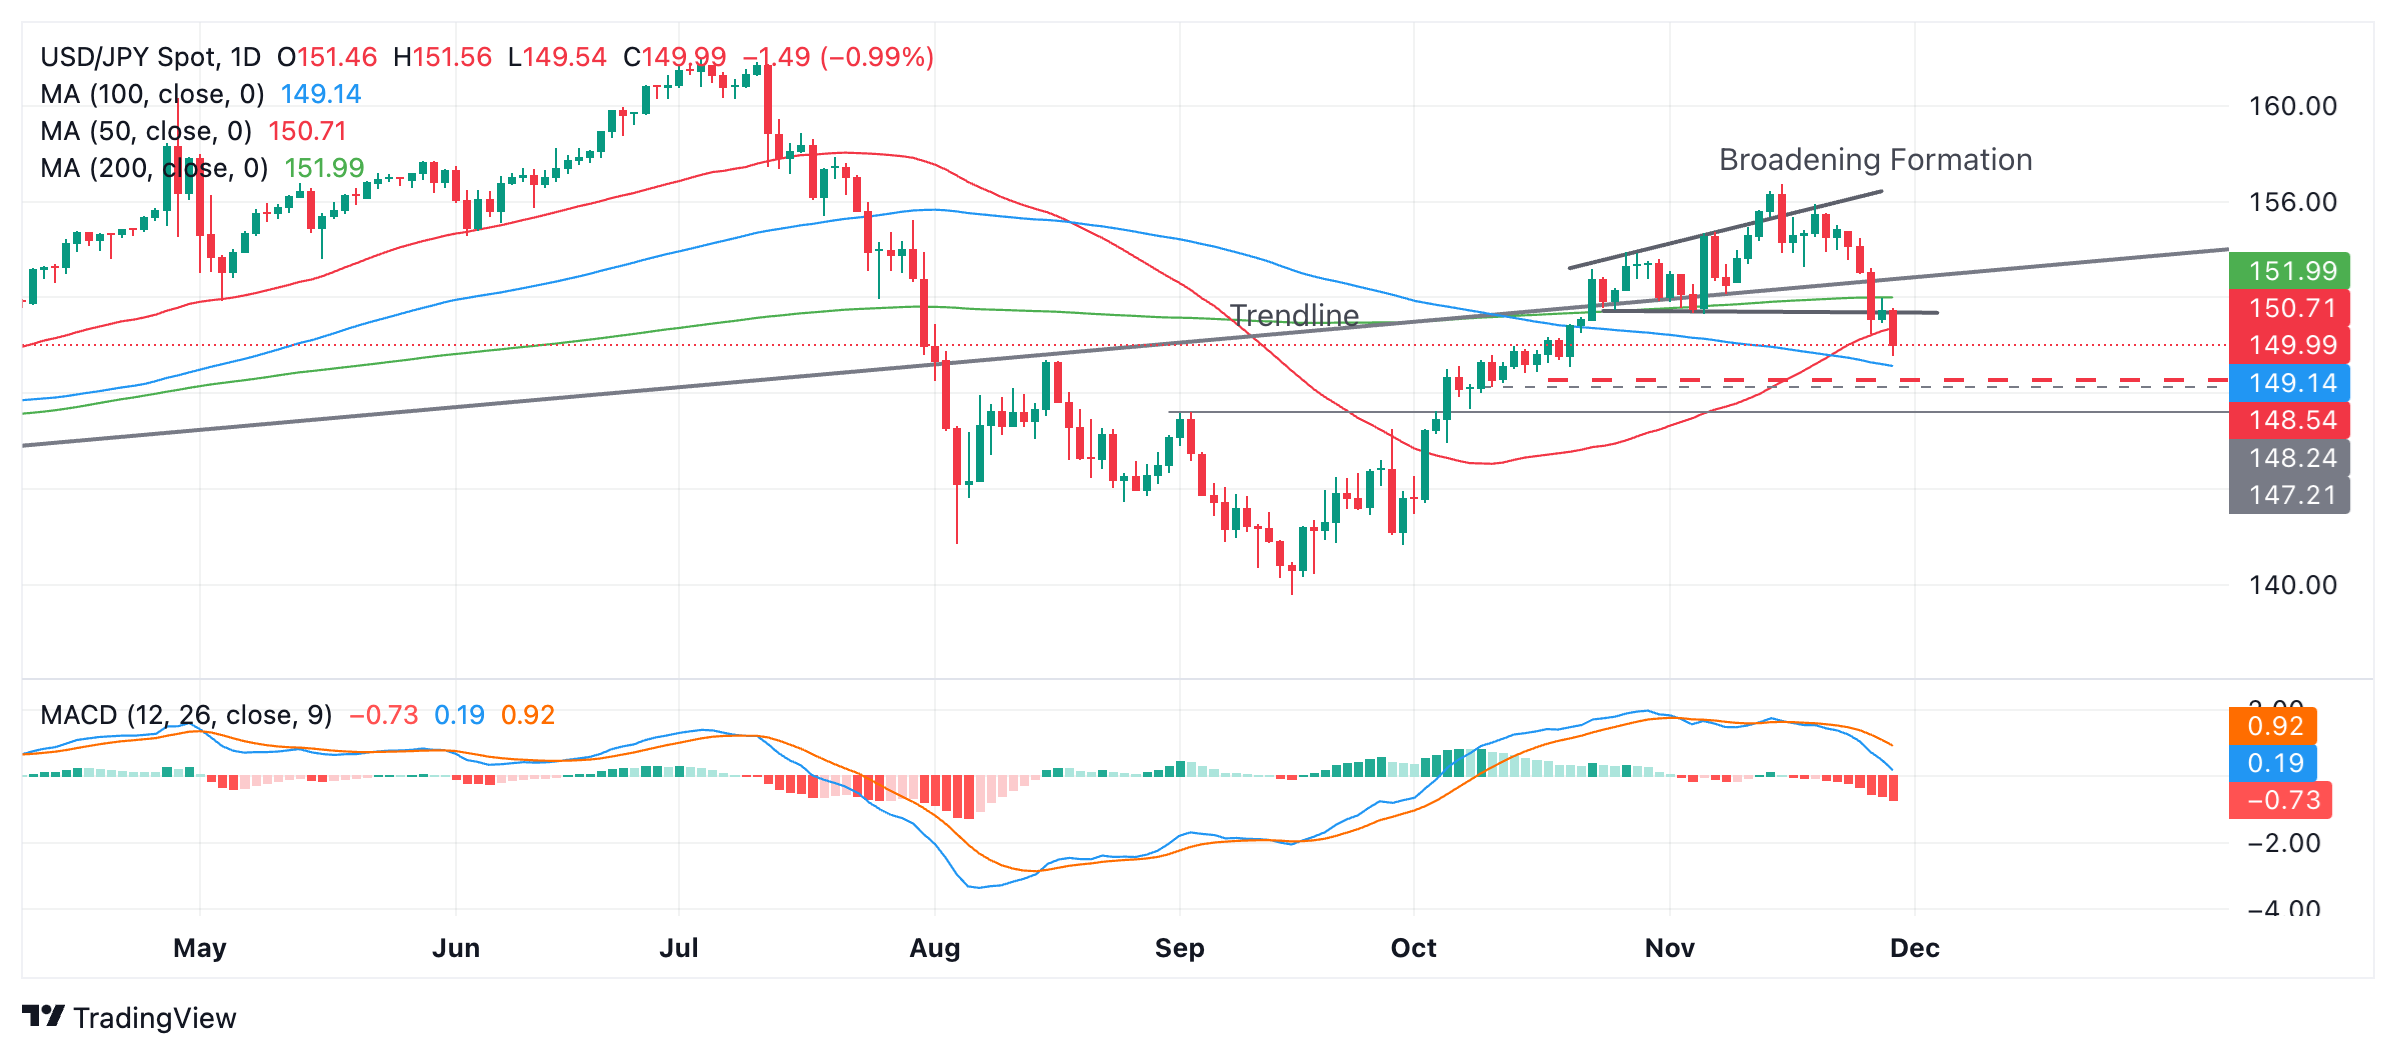
- USD/JPY has broken out of a Broadening Formation pattern and is falling towards its target.
- The pair has likely reversed its short-term trend and risks are now to the downside, in line with the bearish bias.
USD/JPY has broken the bottom of a bearish Broadening Formation price pattern and is falling towards the first bearish target at 148.54, the 61.8% Fibonacci extrapolation of the pattern height extrapolated downward.
USD/JPY Daily Chart
Further downtrend could take USD/JPY to the next target at 148.24, the key September 2 high.
The (blue) Moving Average Convergence/Divergence (MACD) momentum indicator is moving away from its red signal line, an additional bearish signal.
The short-term trend has probably reversed from bullish to bearish after the breakout. Since it is a principle of technical analysis that trends tend to extend, the probabilities now favor more short-term weakness.
Source: Fx Street
I am Joshua Winder, a senior-level journalist and editor at World Stock Market. I specialize in covering news related to the stock market and economic trends. With more than 8 years of experience in this field, I have become an expert in financial reporting.


