
- USD/JPY reaches yearly highs and is positioned near the 140.30 level.
- US first-quarter GDP grew 1.3%, beating expectations, while jobless claims topped estimates. Core CPI inflation rose 5% in the first quarter.
- Investors eagerly await today’s release of the Tokyo Consumer Price Index for May.
He USD/JPY rose on Thursday to 140.22, its highest level since November 23, 2022. This rebound comes amid positive economic developments, with US first-quarter GDP growth exceeding expectations and jobless claims exceeding expectations. estimates. In addition, core PCE inflation increased by 5% in the first quarter. In this sense, the positive economic data from the United States, together with the increase in US bond yields due to the greater probability of a Fed tightening, further favored the dollar.
On the other hand, investors will closely monitor the Tokyo Consumer Price Index for May, which is expected to have a bigger impact on the USD/JPY pair.
US economic data beat expectations
The US Bureau of Economic Analysis recently announced that US Gross Domestic Product (GDP) experienced a 1.3% quarter-on-quarter expansion during the first quarter of 2023, beating the initial estimate of 1.1%. On the other hand, applications for unemployment benefits for the week ending May 19 stood at 229,000, below the 245,000 forecast by consensus. On the other hand, core PCE inflation rose to 5% in the first quarter, exceeding the forecast rate of 4.9%.
In response to concerns expressed by the Federal Open Market Committee (FOMC) regarding economic activity, CME’s FedWatch tool now indicates an increased probability of a 25 basis point rise in interest rates. These developments have fueled a rise in US bond yields, with the 10-year yield reaching 3.79%, reflecting a rise of 3.22% in a single day. In addition, the 2-year yield currently stands at 4.46%, up 2.61%, while the 5-year yield stands at 3.87%, up 3.22%. These movements in bond yields provide additional support for the US dollar.
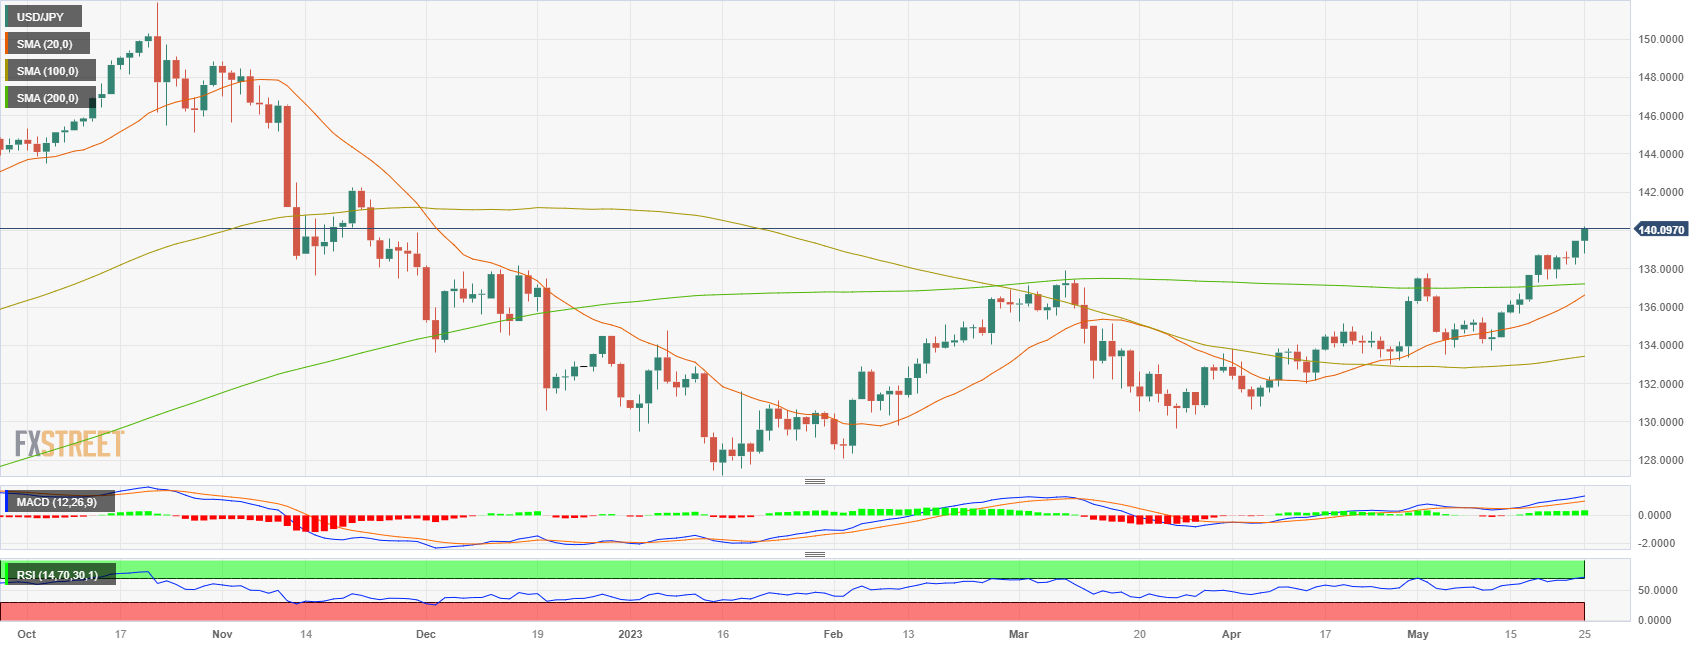
USD/JPY Levels to Watch
Based on daily chart analysis, the pair USD/JPY shows a short-term bullish trend. The Relative Strength Index (RSI) and Moving Average Convergence Divergence (MACD) indicate buyer dominance as the pair remains above its key moving averages.
If USD/JPY continues to gain momentum, it is likely to find resistance at the 140.50 level and the 141.00 psychological level. Conversely, on the downside, important support levels to watch include the 139.50 zone, the 139.00 level, and the weekly low at 138.50.
Source: Fx Street
I am Joshua Winder, a senior-level journalist and editor at World Stock Market. I specialize in covering news related to the stock market and economic trends. With more than 8 years of experience in this field, I have become an expert in financial reporting.


