
- The dollar fails to take advantage of a state of risk aversion caused by falling US bond yields.
- The recently released US economic data would keep the Federal Reserve tightening its monetary policy.
- USD/JPY Price Analysis: Bullish bias, but could consolidate around 135.00/136.00.
The USD/JPY remains under pressure in the North American session, spurred by reduced risk appetite produced by the economic data of the last three days from the United States (USA) suggesting the need for further tightening by the Federal Reserve (Fed). However, USD/JPY has gained ground and is trading at 136.61, due in part to falling US Treasury yields.
Ahead of the Wall Street open, the US Department of Commerce (DoC) revealed that the US Trade Balance widened to $78.2 billion from $74.1 billion in September, below the estimates of $80 billion. Digging deeper into the data, Exports rose $256.6B below the September data, while Imports jumped $334.8B above the previous month’s $332.6B.
Meanwhile, data released since last Friday shows that the labor market in the US remains tight, while Average Hourly Earnings jimping 5.1% YoY added to inflationary pressures. Aside from the employment data, the US Institute for Supply Management (ISM) revealed that the Services PMI rose to 56.6, better than the 53.3 expected.
On the other hand, investor sentiment has moderated since the beginning of the week due to their assessment of the Federal Reserve’s (Fed) reaction to the data. Federal Reserve Chairman Jerome Powell’s speech on Wednesday pivoting to less aggressive rate hikes in the size of 50 basis points spurred a rally in perceived risky assets. However, last week’s data puts Powell at a crossroads, as the Producer Price Index (PPI) will be released on Thursday, followed by the University of Michigan (UoM) Consumer Sentiment and next week the Consumer Price Index (CPI) before the December meeting. Any indication that inflation remains high could again bring an aggressive 75 basis point hike into play.
Therefore, USD/JPY was unable to sustain Tuesday’s rally due to falling US bond yields. The 10-year US Treasury yield fell 2.5 points to 3,550%.
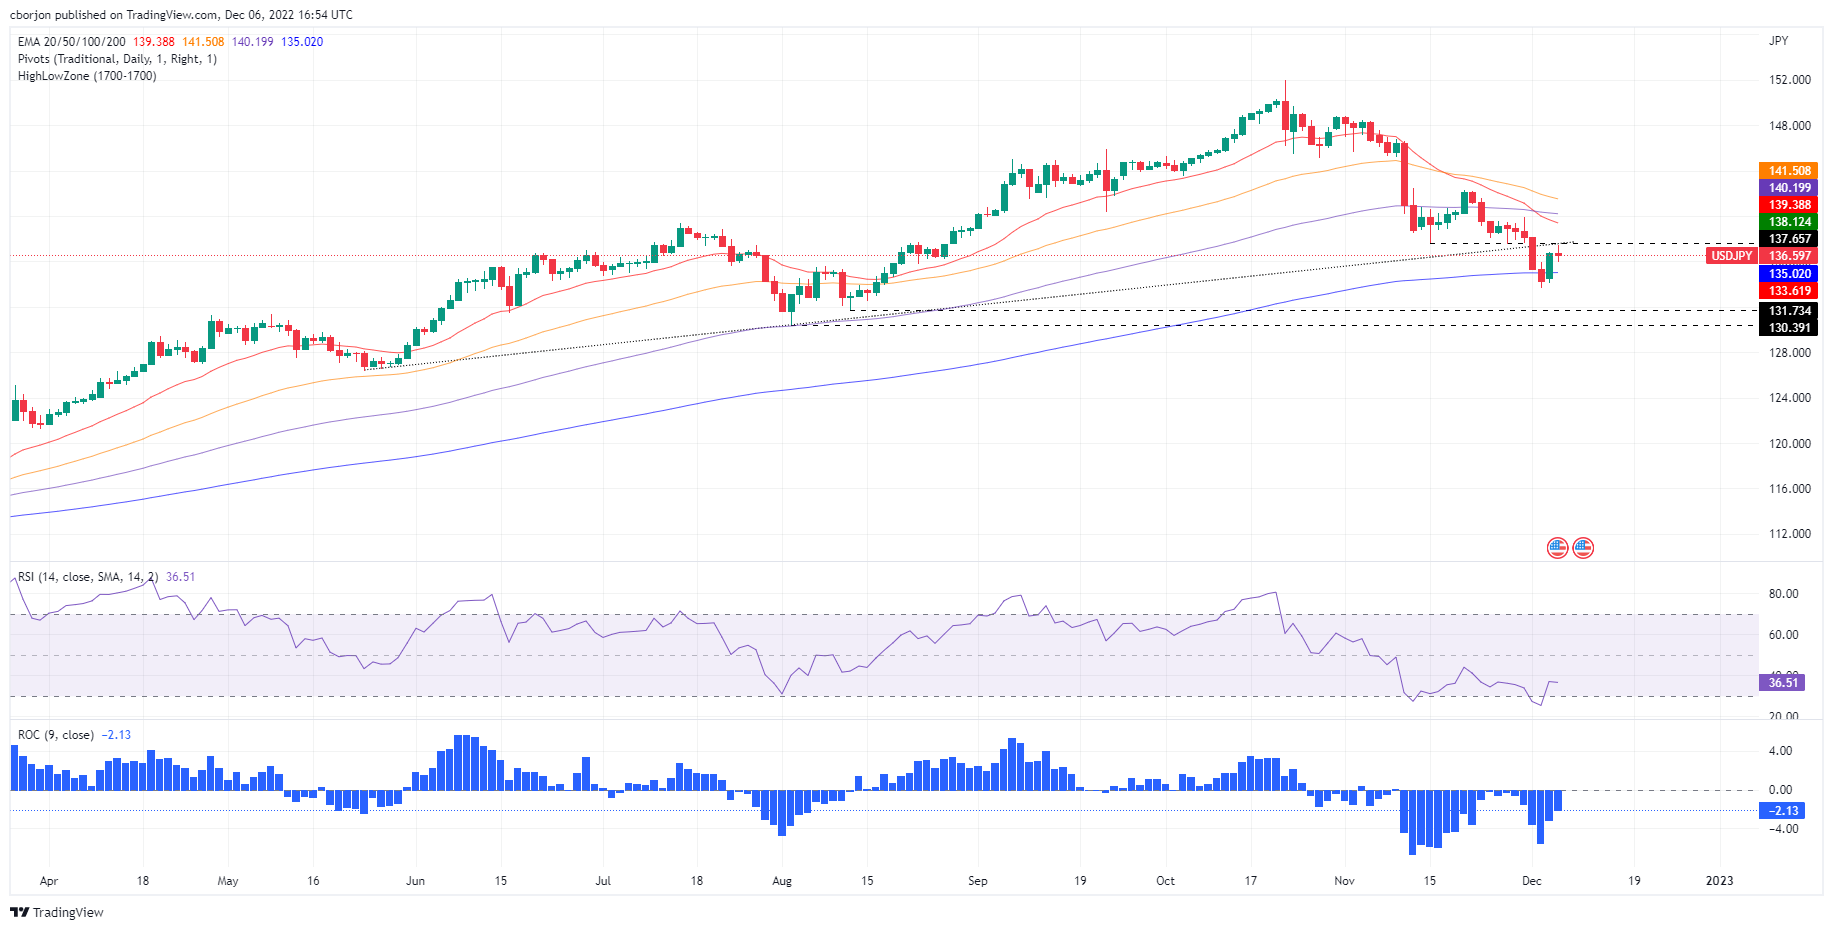
USD/JPY Price Analysis: Technical Perspective
From a daily chart perspective, USD/JPY has a neutral bullish bias. Since last Friday’s breakout of the 200 day EMA, the pair has recovered some ground, although it is testing the lower trend line of a previous rising support trend line around 137.40 points. . Key USD/JPY support levels are found at 136.00, followed by the December 2 daily high at 135.98, followed by the 200 day EMA at 135.01. On the other hand, the first resistance for USD/JPY would be the key psychological level 137.00. Breaking above will expose the uptrend line traced since August 2022 around 137.40, followed by the daily high on December 1 at 138.12.
Source: Fx Street
I am Joshua Winder, a senior-level journalist and editor at World Stock Market. I specialize in covering news related to the stock market and economic trends. With more than 8 years of experience in this field, I have become an expert in financial reporting.


