
- Fed Chairman Powell takes policy meeting by meeting and raises rates 25 basis points.
- The US Central Bank is ready to take action, including raising rates, says the Fed Chairman.
- USD/MXN Price Analysis: Likely break to fresh multi-year lows below 18.00.
USD/MXN plunges to fresh six-year lows, last seen in September 2017, after the US Federal Reserve (Fed) hiked rates by 25 basis points, albeit opening the door for a pause. USD/MXN is trading at 17.8865, down 0.50% at time of writing.
US Federal Reserve Chairman Powell took this stance after he and his colleagues decided to raise rates by 25 basis points and signaled that the US central bank would determine its monetary policy on a meeting-by-meeting basis. Jerome Powell added that inflation is too high and the labor market is tight.
Asked about a rate cut, he said “it would not be appropriate to cut rates, given our view that it will take some time for inflation to come down.” Powell added that the US central bank is “prepared to do more”. , including raising rates if necessary, and that officials did not decide to pause at the next meeting in June.
On Wednesday, the US central bank raised rates by 25 basis points, from 5.00% – 5.25%, but changed its language regarding additional rate hikes. The Fed has become dependent on data and will evaluate future decisions based on information about the economy, inflation and the general behavior of financial markets.
Policymakers added that tightening credit conditions could help the Fed bring inflation to its 2% target. Although today’s Fed decision was perceived as dovish, officials reiterated that inflation is high and the job market strong. Regarding the reduction of the balance sheet, the FOMC decided to continue as planned.
USD/MXN Technical Analysis
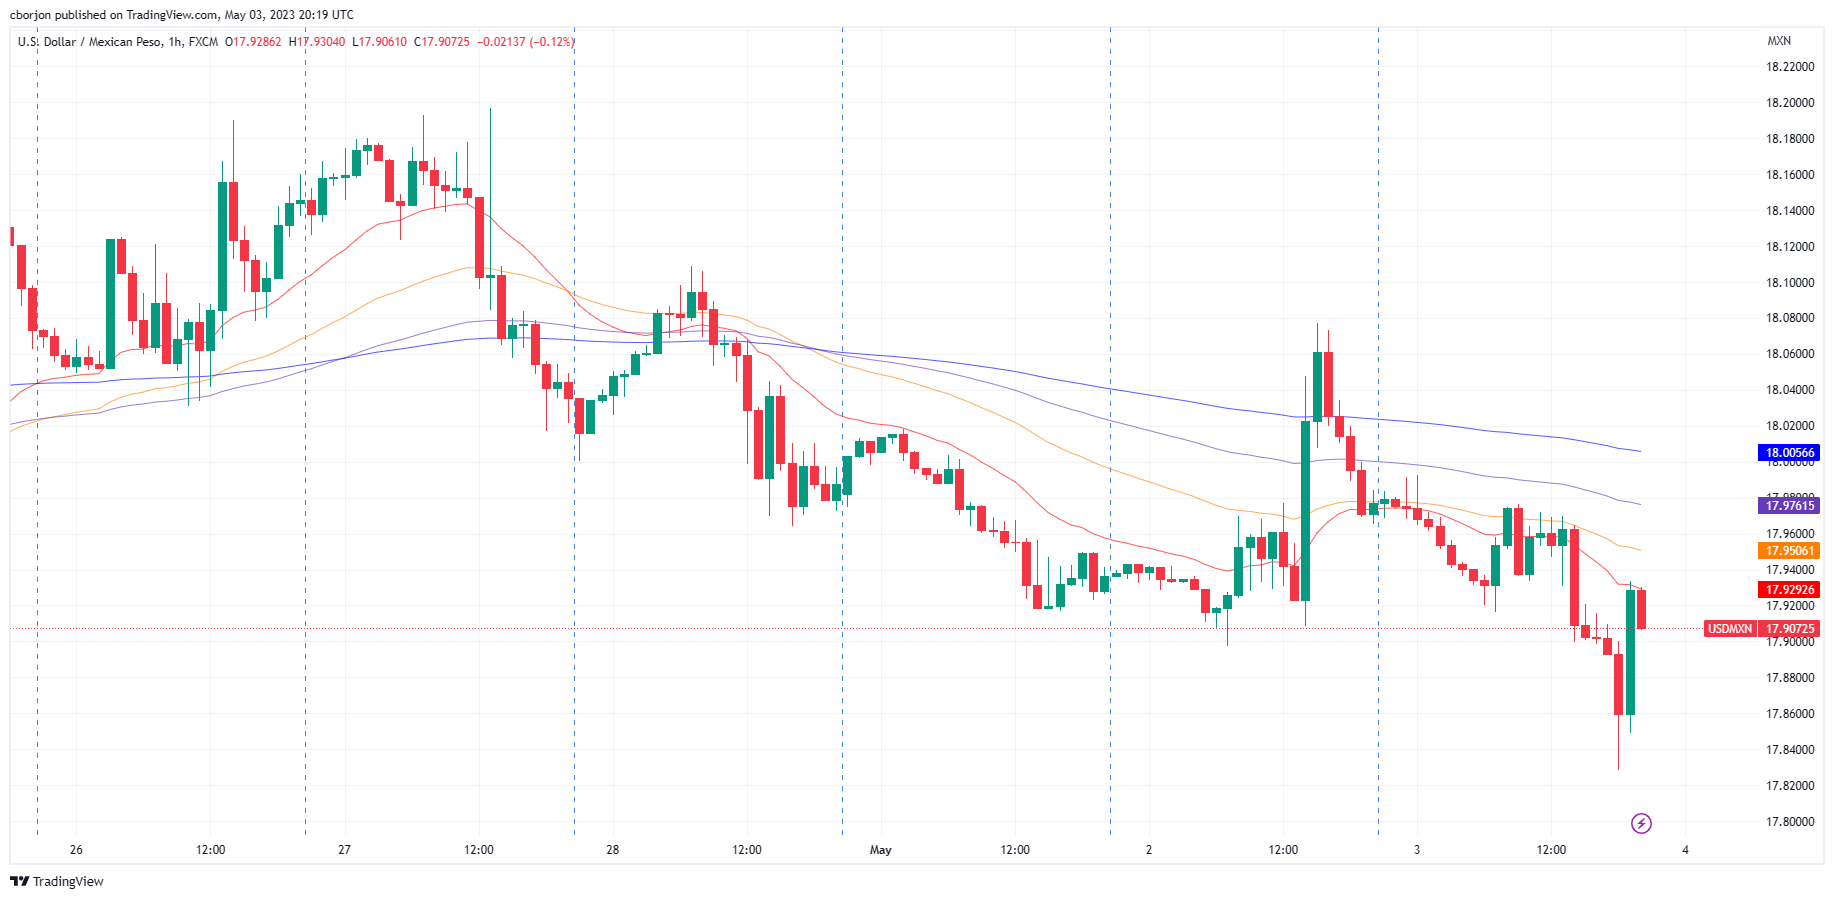
As Fed Chairman Powell spoke at his press conference, USD/MXN hit lows around 17.8283. However, buyers of USD/MXN raised the exchange rates to the current level. If buyers of the USD/MXN want to change the bias to neutral, they need to retrace the 20-day EMA at 18.0566, followed by the 50-day EMA at 18.2511. A break of the latter would reveal the 100-day EMA at 18.5732.
Source: Fx Street
I am Joshua Winder, a senior-level journalist and editor at World Stock Market. I specialize in covering news related to the stock market and economic trends. With more than 8 years of experience in this field, I have become an expert in financial reporting.


