
- Uncertainty surrounding the seizure of the Grupo México railway line by the Mexican government sparks investor fears, causing USD/MXN to rise sharply.
- The unexpected military occupation of the company’s facilities contradicts the campaign promises of Mexican President AMLO, which affects investor sentiment towards the Mexican peso.
- The speeches by the Federal Reserve and the resumption of discussions on the US debt ceiling add to the volatility of the USD/MXN pair, keeping traders on their toes.
He USD/MXN rises sharply, reaching 3-week highs at 17.9609, thanks to general US dollar strength, but also uncertainty surrounding the seizure of the Grupo México railway line by the Mexican government, raising fears among investors in Mexico. Therefore, the USD/MXN opened the week around 17.6960, but at the time of writing it is trading around the 17.85000 zone.
The Mexican Peso falls on investor concern over seizures
An article published by Bloomberg on Friday showed “A section of highway in the state of Veracruz was deemed ‘of public utility’ and transferred to a government entity that is building a line across the Isthmus of Tehuantepec, a relatively narrow strip of land separating the Pacific Ocean and the Gulf of Mexico.
According to Bloomberg, “armed personnel from the Navy occupied the company’s facilities in the Coatzacoalcos-Medias Aguas section starting at 6 am on Friday.” The acquisition surprised the business community, contradicting the campaign promises of Mexican President Andrés Manuel López Obrador that his government would not confiscate private property.
Therefore, investors who bought the Mexican Peso in the midst of its political stability and the rise in interest rates by the Bank of Mexico (Banxico) to 11.25% began to record benefits and reposition themselves at the beginning of the week. Earlier in the Asian session, the USD/MXN pair started the week at 17.6960, but in one hour of trading, it jumped 1,000 points to 17.7957 on uncertainty over the outcome of the Mexican government’s actions.
In addition, discussions on US debt ceilings are set to resume on Monday, as US President Joe Biden returned from the G7 meeting. On Friday, the Republicans walked out of the meeting, stalling negotiations. The US Treasury Secretary, Janet Yellen, declared that the chances of the US being able to pay its bill in mid-June are reduced.
Meanwhile, the light US economic agenda is keeping USD/MXN traders entertained with new speakers from the Federal Reserve. Minnesota Fed President Neil Kashkari said: “I think it’s a very close decision right now, in any case, whether to go up again in June or skip it. The important thing for me is not to signal that we’re done.” Lately, James Bullard, president of the St. Louis Fed, commented that he thinks of two more rate hikes this year.
upcoming events
The US economic agenda will feature new speakers from the Federal Reserve, along with the S&P global PMI final numbers report on Tuesday. On the Mexican front, the agenda will include the first semester of inflation and underlying inflation for May.
USD/MXN Price Analysis: Technical Perspective
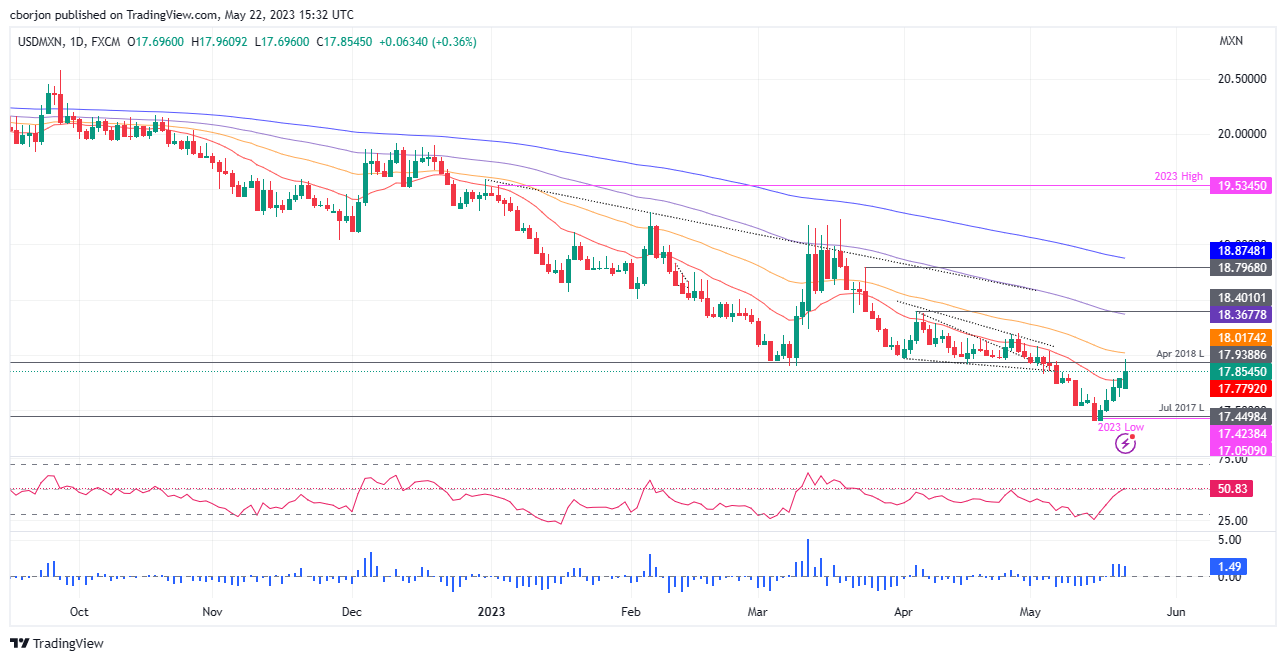
From a technical point of view, the USD/MXN continues to have a neutral to bearish bias. However, the slight recovery on Monday threatened to break through the 18.0000 figure, ahead of the 50 day EMA at 18.01782. In particular, the RSI has turned bullish, breaking through the 50 midline, which could open the door for further buying. Risks to the upside lie at the 22 May high at 17.9609, followed by the confluence of the 50 day EMA and the 18.0000 figure. Breaking above the latter would expose the 100-day EMA at 18.3678. On the other hand, a bearish continuation is likely, below the 20-day EMA at 17.7794 and towards the year-on-year low of 17.4238.
Source: Fx Street
I am Joshua Winder, a senior-level journalist and editor at World Stock Market. I specialize in covering news related to the stock market and economic trends. With more than 8 years of experience in this field, I have become an expert in financial reporting.


