
- USD/MXN recovers slightly after hitting multi-year lows at 16.8083, but remains below 17.0000.
- US initial jobless claims rose less than expected, while the US Producer Price Index (PPI) for June rose 0.1%m/m, below estimates.
- With no economic data out of Mexico, USD/MXN traders focus on US dynamics.
He USD/MXN resumes its downtrend after hitting multi-year lows at 16.8083, and holds below 17.0000 on Thursday, after United States (US) data shows Federal Reserve (Fed) work is about to come true, as inflation continues to decline. At the time of writing, the USD/MXN is trading at 16.8682 after hitting a daily high of 16.9619.
The Mexican Peso gains ground, while the Dollar weakens due to some applications for unemployment benefits and a PPI below expectations
USD/MXN falls on improving risk appetite, at the expense of safe-haven currencies such as the US dollar (USD). Data from the US Department of Labor (DoL) revealed that initial jobless claims last week rose less than estimates of 250,000 to 237,000. The Fed’s Beige Book showed that labor demand “remained healthy” in June, though it noted that hiring “was becoming more targeted and selective.”
At the same time, the US Producer Price Index (PPI) for June rose 0.1%m/m, exceeding May’s 0.4% decline, but below estimates of 0.2%. YoY, PPI grew 0.1%, below forecasts of 0.4%, while core PPI, which excludes volatile items, rose 0.1%m/m, unchanged from May, accelerating below estimates of 0.2%. The annual core PPI cooled off expectations of 2.6% and stood at 2.4%. Thus, the PPI data followed the lead of a weak US CPI report that could prevent Fed officials from raising rates twice, as they previously commented after the June FOMC meeting.
An absent Mexican economic agenda leaves USD/MXN traders focused on US dynamics. As long as the interest rate differential between the US and Mexico favors the latter, further declines are expected. However, traders should be aware that political risks are starting to boil in Mexico, as general elections loom in June 2024.
USD/MXN Price Analysis: Technical Perspective
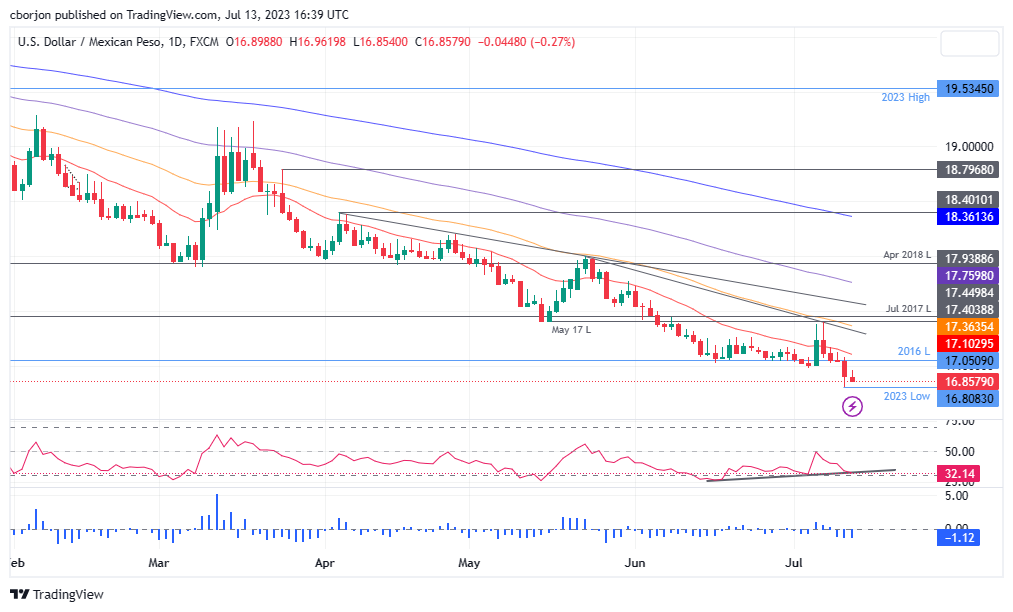
The USD/MXN downtrend is likely to continue as the pair remains below 17.00. Sellers looking for the October 2015 low at 16.3267 keep USD/MXN under pressure, with the next support at 16.5000 before sellers recapture the latter. The next support would emerge at 16.00. Conversely, if USD/MXN buyers recapture the 17.0000 figure, it could exacerbate a rally towards the 20 day EMA at 17.1073 in the near term. USD/MXN must break above the 17.4038 zone to change the bias to neutral.
Source: Fx Street
I am Joshua Winder, a senior-level journalist and editor at World Stock Market. I specialize in covering news related to the stock market and economic trends. With more than 8 years of experience in this field, I have become an expert in financial reporting.


