
- USD/MXN falls close to 0.50% on falling US bond yields and fears of a recession.
- Despite an unchanged interest rate from the Mexican central bank, the Mexican peso is teetering towards year-to-date lows.
- USD/MXN is biased lower, and could test the current year-to-date low and 2016 yearly low, suggesting bearish sentiment in the market.
USD/MXN falls close to 0.50% at the start of the week, undermined by falling US bond yields courtesy of mixed data, despite last week’s jobs report in the United States (US) cemented the case for a further rate hike by the US Federal Reserve (Fed). The Mexican peso (MXN) threatens to fall to new year-to-date lows, despite the fact that Mexico’s central bank kept rates unchanged at its last meeting. The USD/MXN pair is trading at 17.4629 after hitting a high of 17.5971.
USD/MX weakens as US bond yields fall, concerns of a possible US recession rise as hints of further rate hikes from the Fed.
Wall Street is trading at a loss due to deteriorating market sentiment, as data from the Institute for Supply Management (ISM) revealed that the activity of service companies remains in expansionary territory, but slowing down. This, together with a contractionary figure in manufacturing, unleashed fears of a coming recession in the United States. Another piece of the puzzle adding to recessionary anxiety is that factory orders released by the US Census Bureau weakened from 0.6% in April to 0.4% in the last month, excluding transportation, which improved from a drop from -0.7% to -0.2% in March.
Consequently, the dollar remains under pressure, as the US Dollar Index (DXY) shows. The DXY, a basket of six currencies that measures the performance of the USD, fell 0.04% to 103,995, weighed down by falling US bond yields.
Thus, the USD/MXN has fallen from the 17.5950 area, despite the fact that consumer confidence in Mexico stood at 44.4 in May. By contrast, gross fixed income rose 0.5% in March compared to February, the National Institute of Statistics, Geography and Information Technology (INEGI) revealed on Monday.
USD/MXN Price Analysis: Technical Perspective
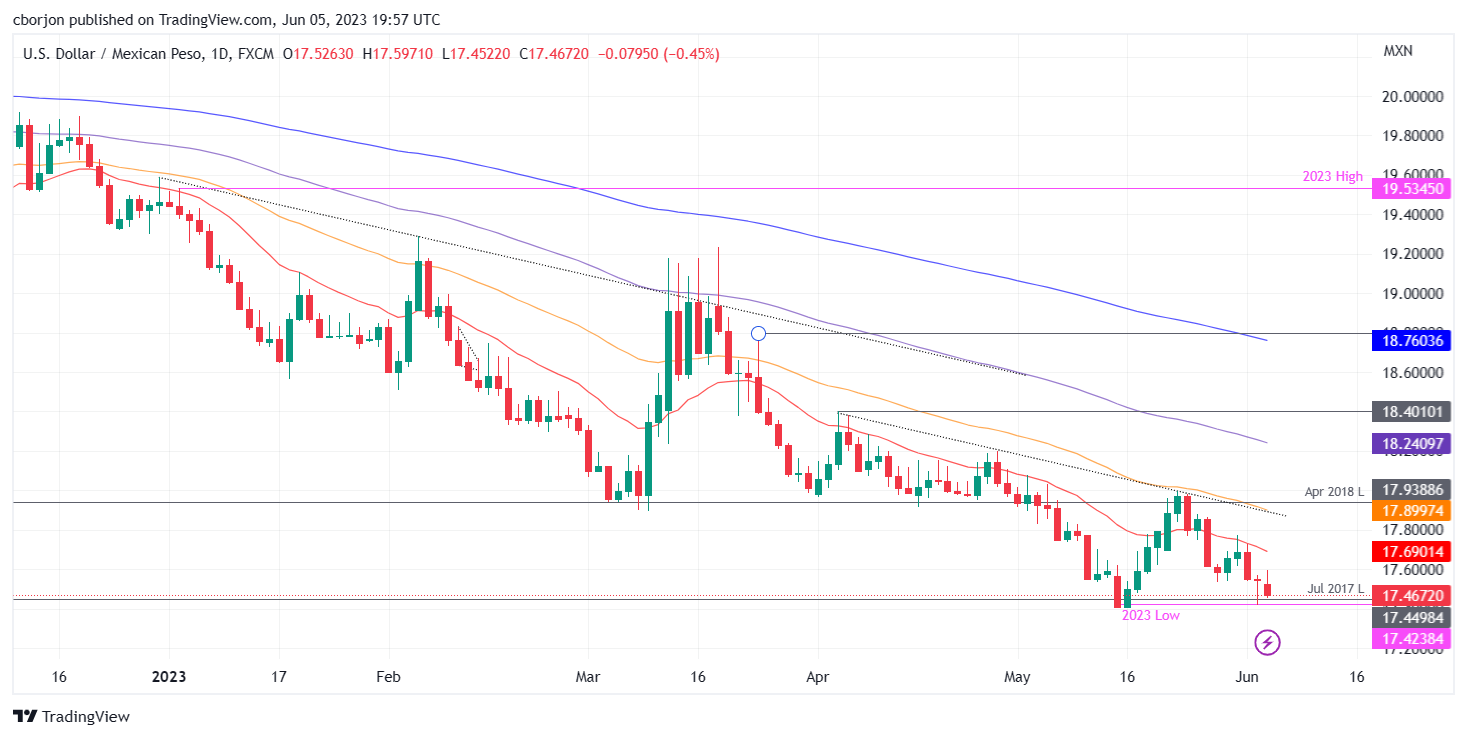
USD/MXN remains biased lower, albeit consolidated around the 17.60/17.40 figure, over the last six trading days, unable to recapture the 20-day EMA at 17.6896, which could exacerbate a rally towards the 50 day EMA at 17.8995, before retesting the 18.00 area. The path of least resistance for the USD/MXN is to the downside and could test the current low of 17.4238. A break of the latter will expose the 2016 yearly low of 17.0509 before dipping to 17.0000.
Source: Fx Street
I am Joshua Winder, a senior-level journalist and editor at World Stock Market. I specialize in covering news related to the stock market and economic trends. With more than 8 years of experience in this field, I have become an expert in financial reporting.


