
- USD/MXN falls to seven-year lows, down 0.63%.
- The deflationary process in Mexico causes the CPI for May to fall more than expected, which will foreseeably prevent Banxico from raising rates.
- Upbeat market sentiment and expectations of a Fed rate pause ahead of next week’s FOMC meeting weigh on the dollar.
- Futures markets have a 33% chance of a Fed rate hike next week 90% chance at the July meeting.
He USD/MXN falls to fresh seven-year lows as the Mexican Peso (MXN) continues to appreciate strongly against the US Dollar (USD), despite the fact that the Mexican central bank is expected to keep rates higher for longer. The USD/MXN is trading at 17.2695, below its opening price.
The Mexican Peso continues to strengthen against the US Dollar
Risk appetite continues to weigh on the dollar on the eve of an important week for the US Federal Reserve (Fed), which will keep rates unchanged at 5.00%-5.25%. Wall Street posts solid gains as traders prepare for next week’s FOMC meeting.
Meanwhile, the deflationary process in Mexico is underway; According to the National Institute of Statistics, Geography and Information Technology (INEGI), the Consumer Price Index (CPI) for May fell -0.22% MoM, well below estimates of -0.16%. In annual terms, the CPI fell below the 6.29% of the previous month, standing at 5.84%, below the consensus of 5.9%.
This would prevent the Bank of Mexico (Banxico) from raising rates, as mentioned by its Governor, Victoria Rodríguez Ceja, who said that the central bank will keep rates unchanged for the next two meetings.
Across the border, an absent economic agenda keeps investors leaning on bullish market sentiment, with the S&P 500 turning bullish after gaining more than 20% since its last slide. As for the Fed’s upcoming policy meeting, money market futures point to a 33% chance of the Fed raising rates next week. However, odds stand at 90% for the July meeting after two major central banks, which have kept rates on hold, rushed to tighten conditions as inflation picked up again.
USD/MXN Price Analysis: Technical Perspective
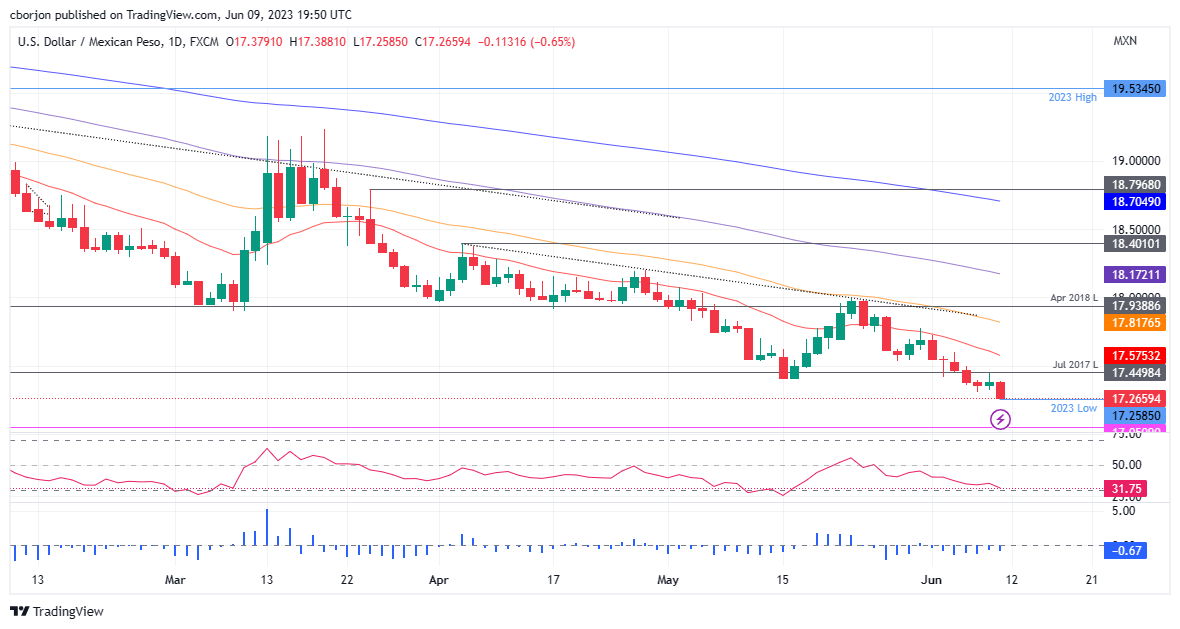
From a technical perspective, the USD/MXN is ready to test lower levels after breaking the July 2017 lows at 17.4498. In an article on Thursday, I mentioned that the pair “seems to be bottoming out” and that a double bottom could be forming, but the price action negated the chart pattern. Therefore, further decline is expected, with 2016 lows at 17.0500 tested soon, followed by the 17.00 figure. Conversely, if USD/MXN buyers rally, the 2017 lows at 17.4498 could exacerbate further MXN weakness and push the pair towards the 20-day EMA at 17.5753.
Source: Fx Street
I am Joshua Winder, a senior-level journalist and editor at World Stock Market. I specialize in covering news related to the stock market and economic trends. With more than 8 years of experience in this field, I have become an expert in financial reporting.


