
- USD/MXN trades in losses below 18.40 driven by risk appetite despite rising US Treasury yields.
- US recession risks had increased, according to Minnesota Fed President Kashkari.
- USD/MXN Price Analysis: Continues its downtrend below 18.7968.
He USD/MXN falls to fresh two-week lows in the US session at 18.3259, and sellers take a breather, trading slightly above the weekly lows. Investor sentiment has been boosted by the overcoming of the banking crisis. Therefore, risk currencies in the FX space are printing gains. The USD/MXN is trading at 18.3902.
USD/MXN hit new weekly lows, despite the deficit in the Mexican Trade Balance
Wall Street opens the week with gains. The low economic activity in the United States keeps operators attentive to global banking developments. News of First Citizens BancShares, Inc. agreeing to buy SVB Financial Group sparked a surge in sentiment, sending USD/MXN tumbling to fresh weekly lows. However, US Treasury yields are picking up, capping the USD/MXN slide.
US Treasury yields are rising, with the benchmark 10-year note rate at 3.473%, gaining nearly ten basis points. However, the dollar has not been able to keep pace with US Treasury yields, and the Dollar Index posted losses of 0.14% to 102.973.
Meanwhile, money market futures expect the US Federal Reserve (Fed) to keep rates unchanged at the May meeting, as CME’s FedWatch tool shows. The odds stand at 63.8%, versus 38.2% for a 25 basis point rate hike.
Over the weekend, Minnesota Fed President Neil Kashkari said recessionary risks have increased following the crisis in the banking system.
On the Mexican front, the trade balance for February fell short of estimates of a surplus of 900 million dollars and showed a deficit of 1.840 million dollars. However, the figures showed some improvement after the deficit of 4.125 million dollars in January. Exports were down 2.80% yoy in February as crude oil exports fell 19.2% while imports grew 4.1% yoy.
USD/MXN Technical Analysis
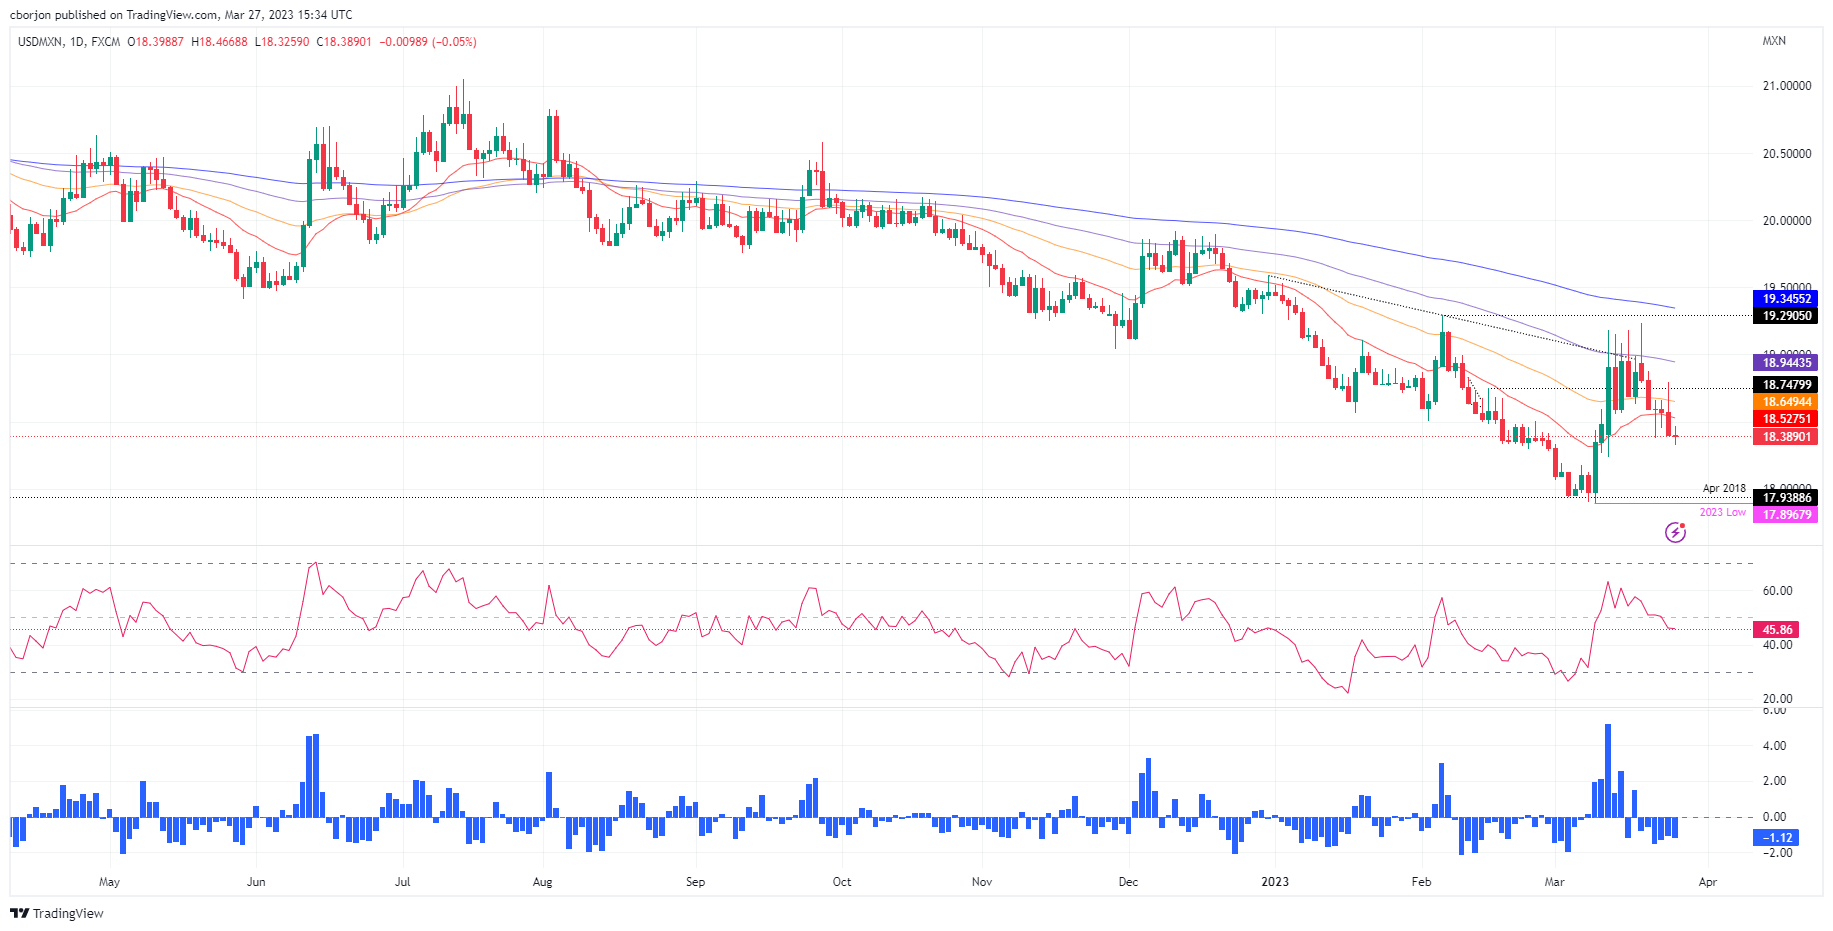
USD/MXN maintains a neutral bias to the downside, capped by the 20-day EMA around 18.5290, slightly above the psychological figure of 18.50. Oscillators remained in bearish zones, with the Relative Strength Index (RSI) below 50, while the Rate of Change (RoC) remained below the neutral line. Therefore, further downside is warranted, but market mood could spur a reversal.
Therefore, the first support for USD/MXN would be the weekly low at 18.3259. A break of the latter would expose the March 13 low at 18.2369, followed by the year-on-year low at 17.8967. On the other hand, if USD/MXN recovers to 18.50, it could open the door for further gains. But as long as USD/MXN stays below 18.7968, the pair will remain on the downside.
Source: Fx Street
I am Joshua Winder, a senior-level journalist and editor at World Stock Market. I specialize in covering news related to the stock market and economic trends. With more than 8 years of experience in this field, I have become an expert in financial reporting.


