
- The expectation of the markets for Banxico’s monetary policy decision influences the USD/MXN trade.
- The disappointing New York Empire State Manufacturing Index adds to the US dollar’s woes.
- Debt ceiling talks in the US and mixed messages from Federal Reserve spokespeople weigh on market sentiment.
USD/MXN extends its slide as the Mexican Peso (MXN) continues to strengthen, with USD/MXN falling to a fresh seven-year low around 17.4339, surpassing the July 2017 low of 17.4498, amid a boost to risk appetite that keeps most US stocks higher. The safety status of the US dollar (USD) has been jeopardized as a light US economic agenda would leave investors relying on market sentiment and central bank talk. At the time of writing, the USD/MXN pair is trading at 17.4424, down 0.80%.
Risk appetite and light US economic agenda contribute to USD weakness
The highlight of the week is Banxico’s monetary policy decision, where the central bank is expected to keep rates unchanged at 11.25%. However, some analysts expect a 25 basis point rate hike to 11.50%, after the bank decided to raise rates at a more gradual 25 basis point pace, with the central bank changing its language, saying that since the last monetary policy meeting, “annual headline inflation has fallen more than expected.” For its next decision, the Council will take into account the inflation outlook, considering the orientation already achieved for monetary policy.”
BBH analysts noted that since Banxico’s last policy meeting, “both headline and core inflation have continued to fall, so we think rates are likely to hold steady this week.” The swap market sees a stable rate for the next three months, followed by the start of an easing cycle in the next three months, which seems too soon to us.”
Therefore, the reaction of the USD/MXN on Monday could be due to the positioning of the operators awaiting the decision of the Bank of Mexico.
On the other hand, the US economic calendar revealed that the New York Empire State Manufacturing Index disappointed investors, falling to -31.3 against the estimated -3.9. Report that almost 50% of respondents said that business conditions had worsened, with the orders index declining, while the price indicator registered an increase and the employment component contracted.
Rising prices are likely to prevent the US Federal Reserve (Fed) from pausing its monetary policy, as Jerome Powell and Co. opened the door for a pause in subsequent policy meetings.
Meanwhile, discussions of raising the US debt ceiling in the United States (US) continued to grab the headlines. US President Joe Biden commented that the talks were “advancing”, while Lael Brainard, National Director of Economic Affairs, commented that the negotiations between the two parties were serious and constructive.
Federal Reserve spokesmen delivered statements, with a solid battle between the hawks and doves continuing. On the hawks’ side, Minnesota Fed President Neil Kashkari, while stressing that inflation is high but slowing, said the Fed has more work to do. Echoing some of his comments, Richmond Fed President Thomas Barkin said: “If inflation persists, or God forbid accelerates, there is no barrier in my mind to further rate hikes.” he told the Financial Times.
USD/MXN Price Analysis: Technical Insights
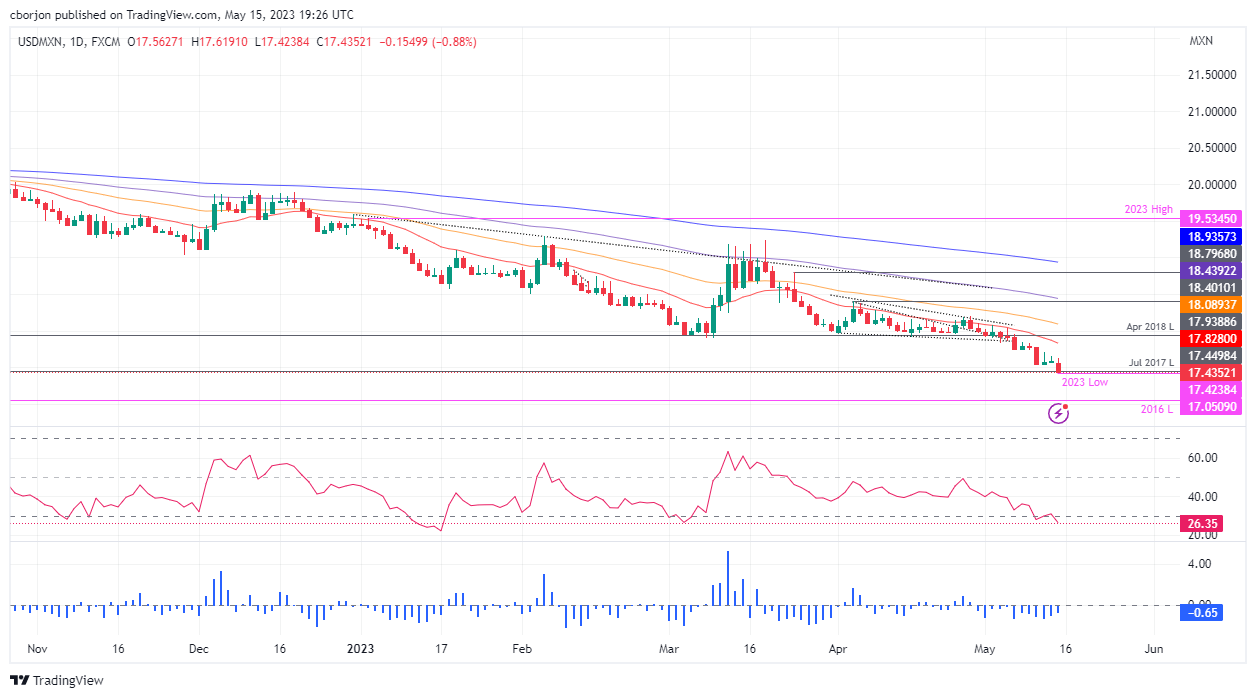
USD/MXN is likely to continue in a downtrend as price action shows. Given that Banxico would either keep rates unchanged or surprise the markets with a 25 basis point rate hike, it is not ruled out that the USD/MXN falls to the 2016 year low of 17.0509, before breaking the figure of 17.0000. However, if USD/MXN buyers recapture 17.5000, that could clear the way for a test of the 20-day EMA at 17.8281 before recapturing the psychological level of 18.0000.
Source: Fx Street
I am Joshua Winder, a senior-level journalist and editor at World Stock Market. I specialize in covering news related to the stock market and economic trends. With more than 8 years of experience in this field, I have become an expert in financial reporting.


