
- USD/MXN fails to break through key resistance near 20.20.
- Breaking above 20.20 would give the dollar a boost.
- The price continues to consolidate around 20.00.
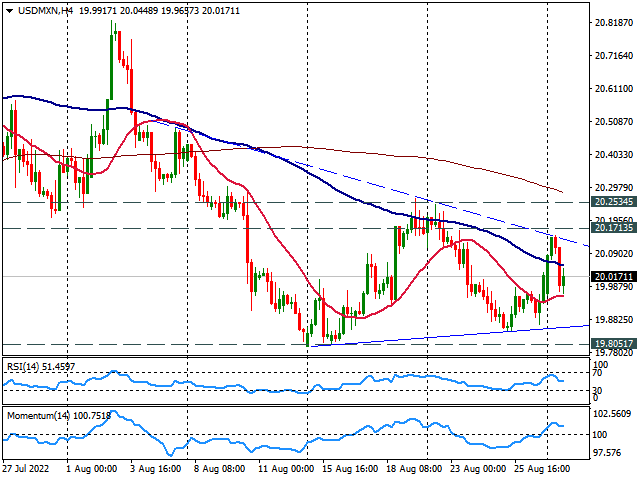
The USD/MXN it is sideways on Monday as it pulled back after reaching the highest level in almost a week at 20.16. The pair tested a critical resistance zone around 20.17, the convergence of a short-term downtrend line and the 20 and 200 SMAs.
A break above 20.20 should give the dollar momentum and a close above 20.25 would point to further gains, with next resistance at 20.45.
A drop below 19.98 should lead the Mexican peso to test the 19.90 support zone. A break lower would expose the August low around 19.80, a strong support level that is likely to hold, favoring a bounce to 19.90 before a break lower.
From a broader perspective, USD/MXN continues to consolidate around 20.00, moving with no clear direction. With the price below the key daily moving average, the trend is down with momentum below 100. Although other technical indicators such as the RSI are flat around their mid-lines.
USD/MXN 4-hour chart
USD/MXN daily chart
Source: Fx Street
With 6 years of experience, I bring to the table captivating and informative writing in the world news category. My expertise covers a range of industries, including tourism, technology, forex and stocks. From brief social media posts to in-depth articles, I am dedicated to creating compelling content for various platforms.


