
- USD/MXN finds new selling to reverse the corrective bounce started the day before from the multi-month low.
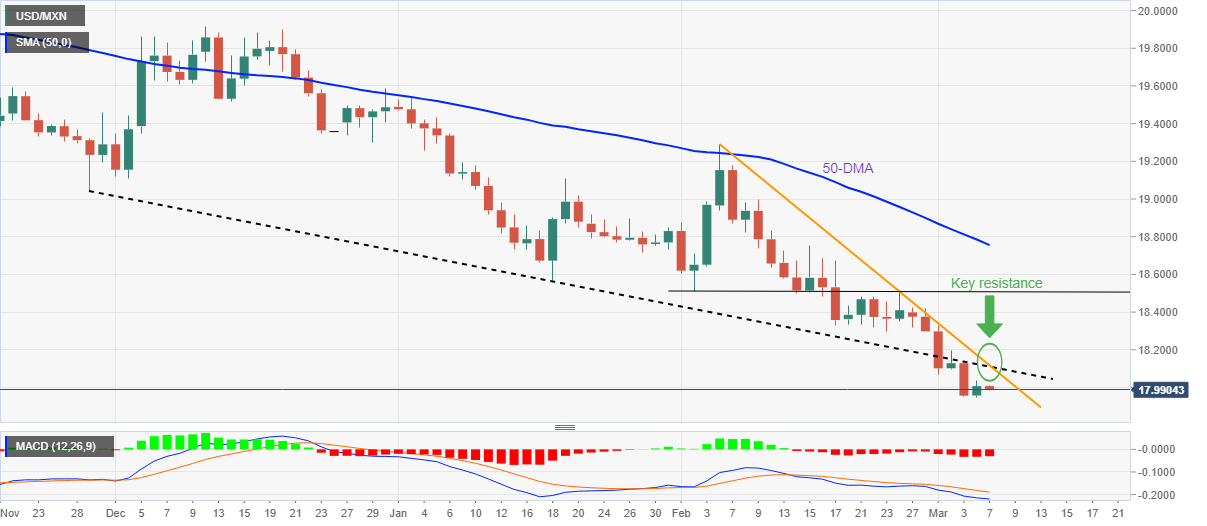
- Bearish signals from the MACD and a sustained move below the 50-day SMA keep sellers on their toes.
- The convergence of the previous support line from November 2022 and the month-old downtrend line looks like a crucial hurdle to the upside.
USD/MXN bears are back in the game, after a day’s absence, as the pair falls to 17.99, shedding 0.10% intraday, at the start of the European session on Tuesday.
In this way, the pair reverses the corrective bounce of the previous day from the lowest levels since April 2018.
It is worth noting that the latest USD/MXN losses come on bearish signals from the MACD, as well as sustained trading below the 50-day SMA. Adding strength to the downside bias could be the failure to break above the confluence of resistance at 18.10 during the previous day’s bounce.
That being said, a downtrend line from early February and a downtrend line from 14 weeks ago, previous support, make up the confluence of resistance at 18.10.
Should the pair break above the 18.10 barrier, a move towards five-week-old horizontal resistance near 18.50 cannot be ruled out. However, USD/MXN bears remain hopeful unless the pair rises to the 50-day SMA at 18.75.
On the other hand, the latest low around 17.95 and the April 2018 low of 17.90 attract USD/MXN sellers.
Further down, the September 2017 low and 2017 low, near 17.60 and 17.45 respectively, may be targets on the bears’ radar.
USD/MXN daily chart
Trend: More falls are expected
Source: Fx Street
I am Joshua Winder, a senior-level journalist and editor at World Stock Market. I specialize in covering news related to the stock market and economic trends. With more than 8 years of experience in this field, I have become an expert in financial reporting.


