
- USD/MXN with a bearish bias in the very short term, in range.
- Next support below 19.90 at 19.80.
- Critical resistance around 20.20/25.
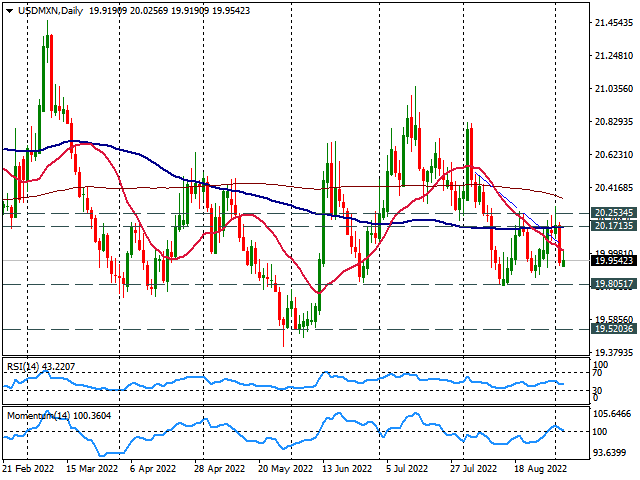
The USD/MXN is rising modestly on Monday as it continues to trade near the weekly low it hit earlier in the week at 19.91. Momentum and technical indicators point to the downside in the very short term. A break below 19.90 would expose the next support zone at 19.80.
Since mid-August, the USD/MXN has been moving sideways in a range between 19.80 and 20.25. The 19.80 zone should hold if tested in the short term, offering a bounce. A firm break lower would further weaken the dollar, exposing 19.72.
On the upside, immediate resistance is at 20.02 (20-day SMA), followed by 20.17. A daily close above 20.25 would change the short-term bias to neutral/bullish and open the door for more gains, targeting the 20.45 area initially.
USD/MXN daily chart
Technical levels
Source: Fx Street
With 6 years of experience, I bring to the table captivating and informative writing in the world news category. My expertise covers a range of industries, including tourism, technology, forex and stocks. From brief social media posts to in-depth articles, I am dedicated to creating compelling content for various platforms.


 meeting for peace: “First step towards reconciliation”")


