
- USD/MXN remains under pressure at two-week lows after breaking a two-day uptrend.
- The clear break below the short-term support line and the bearish signals from the MACD favor buyers of the Mexican Peso.
- The 50-day SMA and the descending resistance line from late April add to the upside filters.
- Oscillators keep sellers hopeful, but the downside looks limited.
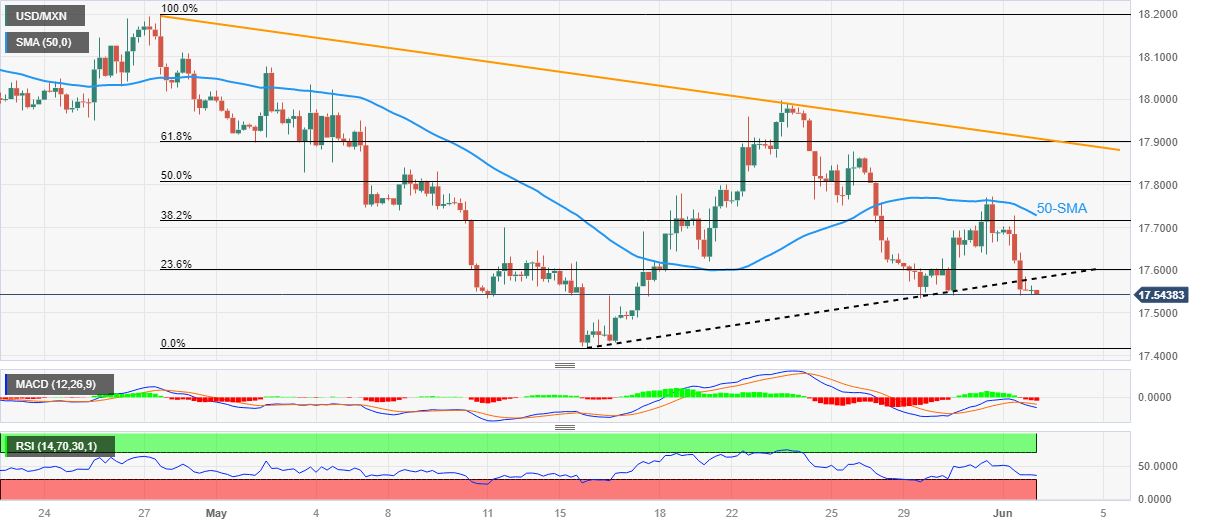
USD/MXN is trading at intraday lows near 17.52, as the previous day’s bearish movement continues. In doing so, the pair extends the mid-week turnaround from the 50 SMA on the 4-hour chart, as well as the breakout of a two-week-old uptrend line.
Not only a U-turn from the key short-term moving average and the break of the support line, but the bearish signals from the MACD also favor USD/MXN sellers. However, the RSI (14) remains below 50 and therefore suggests limited room to the downside.
Consequently, the multi-month low marked in May around 17.42 gains the attention of USD/MXN sellers.
Should the USD/MXN remain bearish beyond 17.42, it will witness a bumpy road towards the psychological magnet of 17.00. That being said, the 2016 year low at 17.05 may act as intermediate support.
On the other hand, recovery moves need to break past immediate support-turned-resistance around 17.58 to attract USD/MXN buyers.
Still, the 50 SMA around 17.73 may challenge buyers of the pair before giving them control.
It is worth noting that a convergence of the late April bearish resistance line and the 61.8% Fibonacci retracement of the April-May dip around 17.90, quickly followed by the round 18.00 level, acts as the last defense of the bears
USD/MXN 4-hour chart
Trend: Limited falls expected
Source: Fx Street
I am Joshua Winder, a senior-level journalist and editor at World Stock Market. I specialize in covering news related to the stock market and economic trends. With more than 8 years of experience in this field, I have become an expert in financial reporting.


