
- USD/MXN remains under pressure for the fourth day in a row at multi-day lows.
- Bearish MACD signals favor a clear break below the three-week horizontal support to keep sellers hopeful.
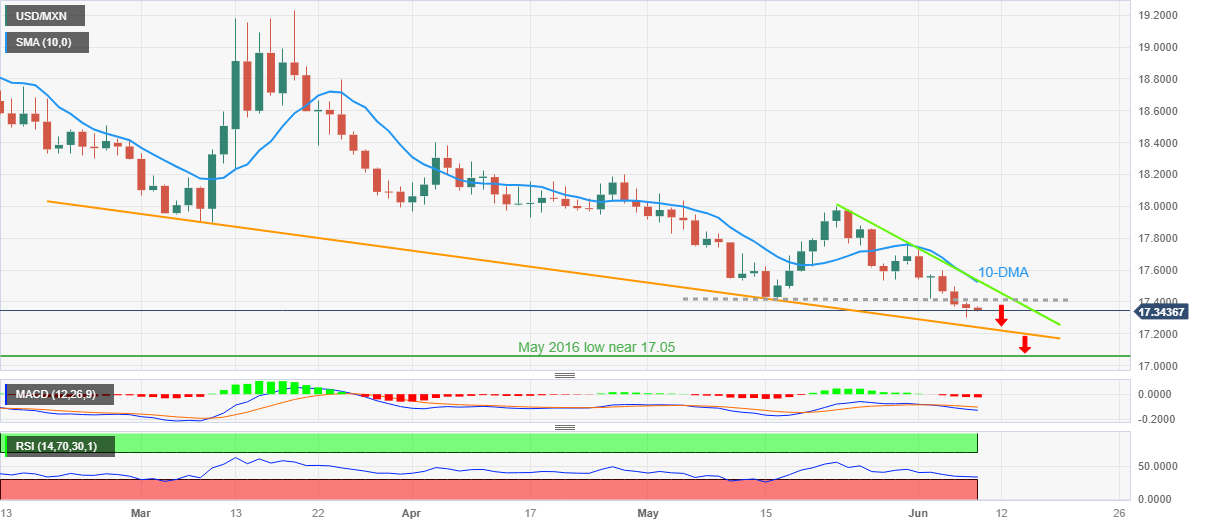
- The three-month descending support line may bolster Mexican Peso buyers amid adverse RSI conditions.
USD/MXN tests the intraday low around 17.33 during the early hours of the European session on Thursday. In doing so, the Mexican Peso (MXN) pair fades late Wednesday’s corrective rebound from the lowest levels since May 2016 (17.30), while posting a four-day losing streak.
Banco de México is about to release inflation data for May, which in turn may stimulate USD/MXN bears coinciding with bearish forecasts, as annual CPI is expected to fall to 5.9% from 6.25% April.
That being said, sellers of the pair are taking hints of Tuesday’s break below 3-week horizontal support, now resistance around 17.42. USD/MXN sellers are also motivated by bearish signals from the MACD.
However, a downward sloping support line from early March, near 17.25 at press time, challenges the pair’s bears amid the oversold line of the RSI (14).
Therefore, Mexican Peso buyers can hold the reins, but their dominance appears limited in scope, down to 17.25.
Should the pair break the support at 17.25, the May-March 2016 lows near 17.10/05 and the psychological magnet at 17.00 will attract USD/MXN bears.
Meanwhile, recovery moves need to cross the previous support line that ran from mid-May, near 17.42, to convince intraday buyers.
Still, a convergence of the 10 DMA and a 15-day downtrend line near 17.52 looks like a tough nut to crack for Mexican Peso sellers to regain control.
USD/MXN: Daily chart
Trend: Limited dips expected
Source: Fx Street
I am Joshua Winder, a senior-level journalist and editor at World Stock Market. I specialize in covering news related to the stock market and economic trends. With more than 8 years of experience in this field, I have become an expert in financial reporting.


