
- USD/MXN stops the rebound from the lowest level since May 2016.
- The support line from a fortnight ago and the oversold RSI challenge buyers of the Mexican Peso.
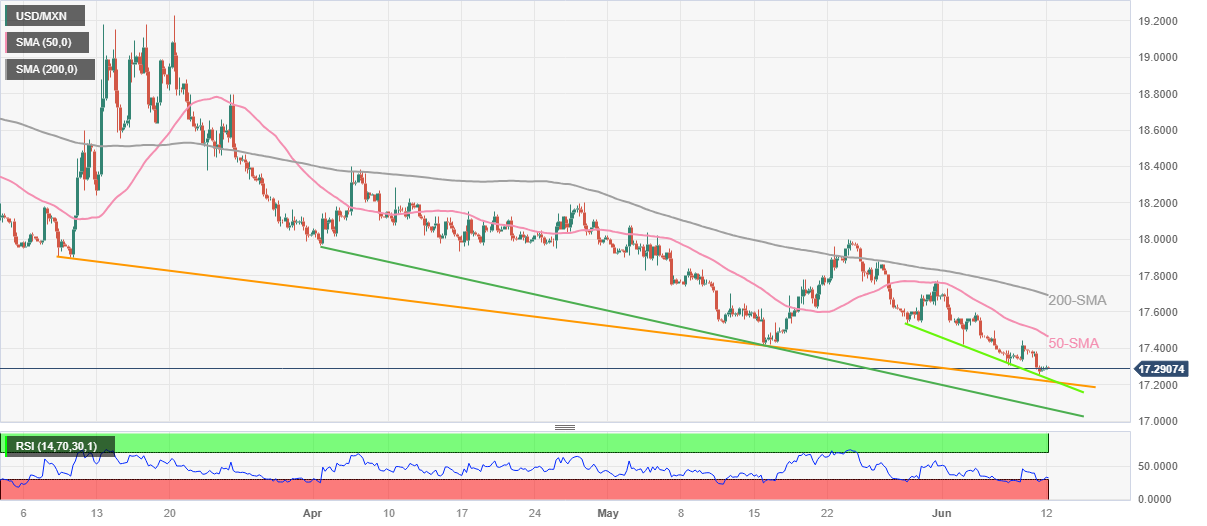
- The 50 SMA caps the USD/MXN rally in the short term ahead of the key hurdle of the 200 SMA.
- Multiple support lines and the 2016 low remain strong to challenge sellers of the pair.
The USD/MXN consolidates the biggest daily loss in almost two weeks, at the lowest levels since May 2016, during the European session on Monday. In doing so, the USD/MXN follows cautious market sentiment, as well as positioning for US inflation data and the Federal Reserve’s (Fed) monetary policy decision.
Technically, the USD/MXN pair is struggling to defend the previous day’s rebound from a bearish support line on May 29 amid an oversold RSI.
Not only the oversold conditions of the RSI and the near-term support line, around 17.23, but also a three-month-old downtrend line, near 17.21, are also challenging USD/MXN bears.
It is worth noting that a descending support line from early April near 17.06 precedes a 2016 low around 17.05 and a round level of 17.00 to challenge further declines in the pair.
Conversely, the 50 SMA on the 4-hour chart around 17.47 capped the USD/MXN pair’s immediate rally ahead of the 200 SMA hurdle at 17.69.
Should USD/MXN bulls manage to maintain control above that last level, as well as break above the 17.70 level, the corrective bounce could target the late May high around 17.99.
USD/MXN 4-hour chart
Trend: Limited falls expected
Source: Fx Street
I am Joshua Winder, a senior-level journalist and editor at World Stock Market. I specialize in covering news related to the stock market and economic trends. With more than 8 years of experience in this field, I have become an expert in financial reporting.


