
- USD/MXN is trading with a positive bias for the third day in a row, although it lacks follow-through.
- The technical situation favors the appearance of new sales at higher levels.
- Reducing Fed rate cut bets continues to support the USD and should limit declines.
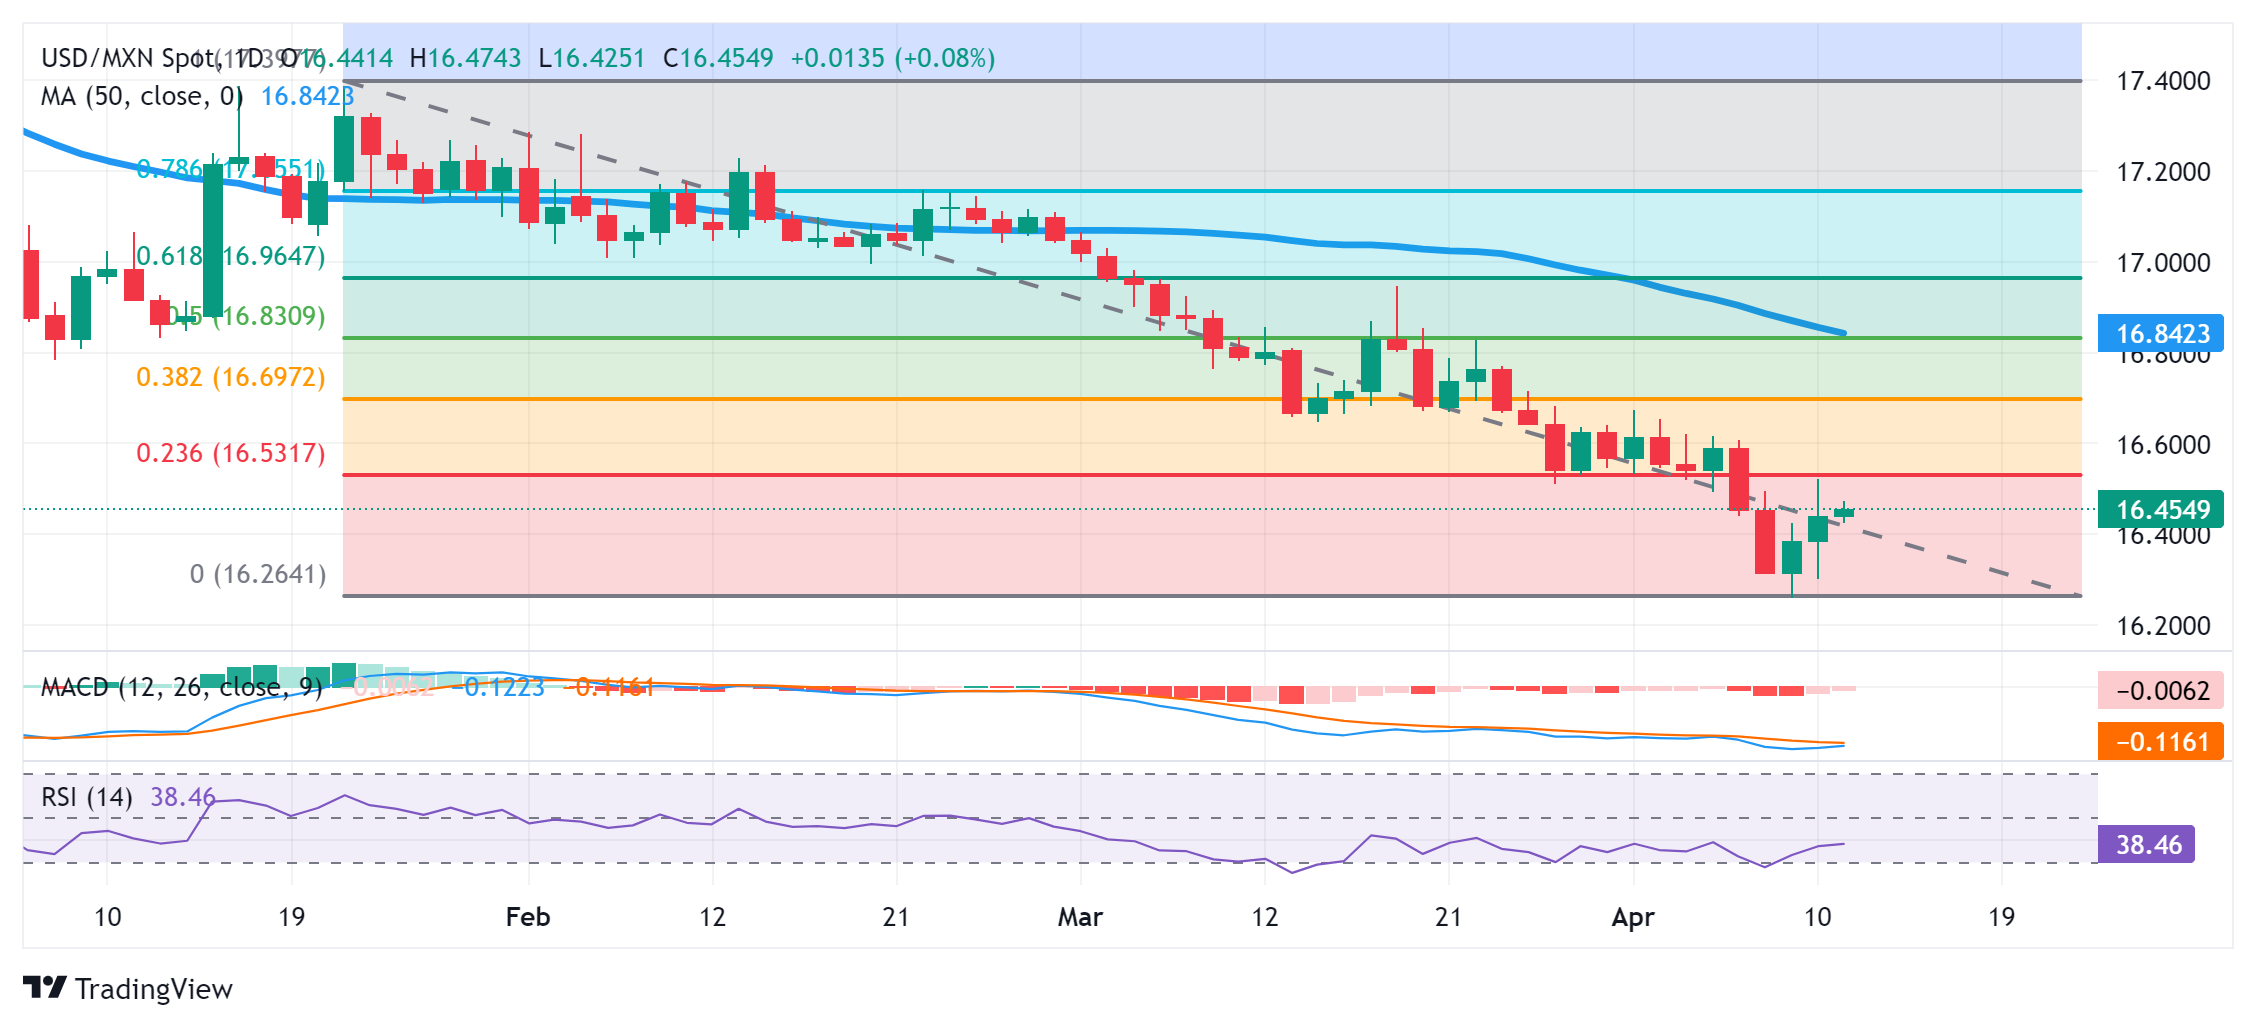
The USD/MXN pair attracts some buyers for the third day in a row on Thursday, although it lacks bullish conviction and remains below the weekly high, around the 16.50-16.55 area touched the previous day.
This zone represents the 23.6% Fibonacci level of the January-April decline and should act as a key point for short-term traders. Sustained strength beyond could trigger a short rally and lift the USD/MXN pair to the next relevant hurdle near the 16.65-16.70 supply zone, or the 38.2% Fibonacci level. Continued buying should pave the way to challenge the 16.85 confluence hurdle, which comprises the 100-day SMA and the 50% Fibo level.
Meanwhile, technical indicators on the daily chart, although they have recovered, remain in negative territory and suggest that any significant rise could be considered a selling opportunity. This, in turn, warrants some caution for bullish traders before confirming that the USD/MXN pair has bottomed in the short term. Meanwhile, the 16.30-16.25 area, or the lowest level since August 2015, is likely to protect the bearish side, below which prices could slide to test the 16.00 mark.
Higher-than-expected US consumer inflation figures released on Wednesday forced investors to push back expectations of the first interest rate cut to September. Furthermore, markets are now pricing in the possibility of less than two 25 basis point rate cuts in 2024, helping the US dollar (USD) stay close to the yearly high. This should help the USD/MXN pair defend the aforementioned zone, which if broken decisively, would pave the way for the extension of a bearish trend of more than two months from the yearly high reached in January.
USD/MXN daily chart
Source: Fx Street
I am Joshua Winder, a senior-level journalist and editor at World Stock Market. I specialize in covering news related to the stock market and economic trends. With more than 8 years of experience in this field, I have become an expert in financial reporting.


