
- USD/MXN is trading higher due to the Fed’s hawkish stance on the path of interest rates.
- Momentum indicators suggest a possible bullish sentiment in the price dynamics.
- The 17.7200 level is emerging as the immediate barrier.
USD/MXN continues with gains for the second consecutive day, trading higher around 17.7150 in line with the psychological level of 17.7200 during the Asian session on Tuesday.
A break above the latter could open the doors for the pair to explore the region around the main level of 17.8000, followed by the September high at 17.8174.
This bullish movement is attributed to the US Dollar (USD) benefiting from the market’s caution regarding the US Federal Reserve’s (Fed) interest rate path.
On the downside, the 23.6% Fibonacci retracement at 17.6243 appears to be the key support, following the 38.2% Fibonacci retracement at 17.5049.
A firm break below the level could push USD/MXN to navigate the 14-day EMA at 17.4347, which would be followed by 17.4000.
The current bullish momentum in the pair suggests an uptrend as the 14-day Relative Strength Index (RSI) remains above 50 levels.
The MACD indicator provides a strong signal for the Dollar bulls. The MACD line is above the center line and the signal line. This setup suggests that there is potentially strong momentum in the USD/MXN price movement.
Frequently asked questions about MXN
What is MXN?
The Mexican Peso is the legal tender of Mexico. The MXN is the most traded currency in Latin America and the third most traded on the American continent. The Mexican Peso is the first currency in the world to use the $ sign, prior to the later use of the Dollar. The Mexican Peso or MXN is divided into 100 cents.
What is Banxico and how does it influence the MXN?
Banxico is the Bank of Mexico, the country’s central bank. Created in 1925, it provides the national currency, the MXN, and its priority objective is to preserve its value over time. In addition, the Bank of Mexico manages the country’s international reserves, acts as a lender of last resort to the banks and advises the government economically and financially. Banxico uses the tools and techniques of monetary policy to meet its objective.
How does inflation impact the MXN?
When inflation is high, the value of the Mexican Peso (MXN) tends to decrease. This implies an increase in the cost of living for Mexicans that affects their ability to invest and save. At a general level, inflation affects the Mexican economy because Mexico imports a significant amount of final consumption products, such as gas, fuel, food, clothing, etc., and a large amount of production inputs. On the other hand, the higher the inflation and debt, the less attractive the country is for investors.
How does the Dollar influence the Mexican Peso (MXN)?
The exchange rate between the USD and the MXN affects imports and exports between the United States and Mexico, and may affect demand and trade flows. The price of the Dollar against the Mexican Peso is affected by factors such as monetary policy, interest rates, the consumer price index, economic growth and some geopolitical decisions.
How does the Fed’s monetary policy affect Mexico?
The exchange rate between the USD and the MXN affects imports and exports between the United States and Mexico, and may affect demand and trade flows. The price of the Dollar against the Mexican Peso is affected by factors such as monetary policy, interest rates, the consumer price index, economic growth and some geopolitical decisions.
USD/MXN: Daily Chart
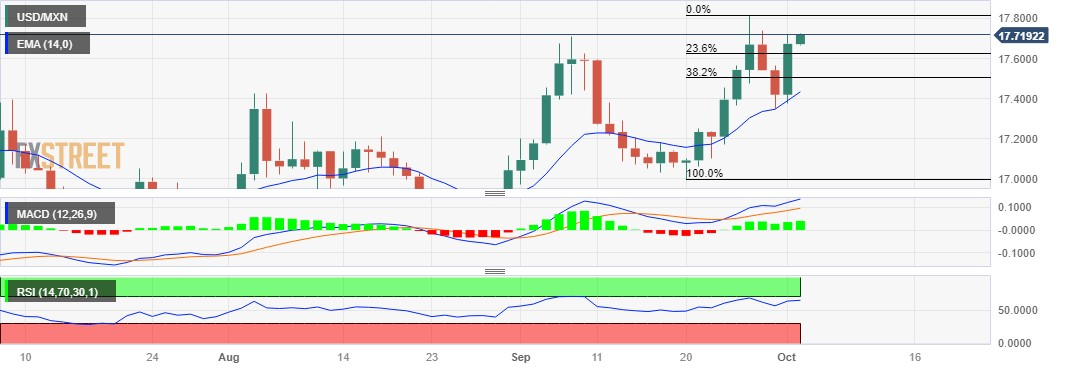
Source: Fx Street
I am Joshua Winder, a senior-level journalist and editor at World Stock Market. I specialize in covering news related to the stock market and economic trends. With more than 8 years of experience in this field, I have become an expert in financial reporting.


