
- USD/MXN consolidates ahead of US economic data release.
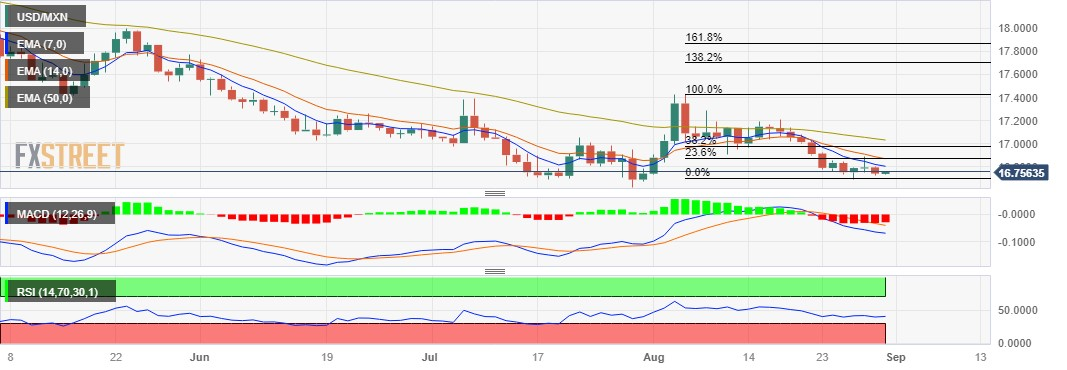
- The seven day EMA looks like immediate resistance aligned with the 14 day EMA and the 23.6% Fibonacci.
- The MACD indicates that the recent momentum is weaker.
USD/MXN is hovering around the 16.75 region during the European session on Thursday. The pair came under downward pressure from dovish data from Mexico and cautious sentiment over the US Federal Reserve’s (Fed) preferred inflation gauge, particularly the Personal Consumption Expenditure Price Index ( US Core PCE) for August.
The seven day EMA at 16.80 is shaping up to be the immediate barrier aligned with both the 14 day EMA and the 23.6% Fibonacci retracement at 16.87. A break above the latter could open the doors for the USD/MXN pair to explore the region around the 38.2% Fibonacci retracement at 16.97.
On the other hand, the pair could find key support at the lows around 16.69, followed by the July lows at 16.62. A break below that level could inspire bears in the pair to navigate the region around the psychological 16.50 level.
The 14-day Relative Strength Index (RSI) remains below 50, indicating a bearish trend in the USD/MXN pair. The MACD line remains below the center line and shows divergence below the signal line, indicating that the recent momentum is weaker.
In the short term, the underlying trend remains down as long as the USD/MXN pair sustains below the 50 day EMA at 17.07.
USD/MXN daily chart
Source: Fx Street
I am Joshua Winder, a senior-level journalist and editor at World Stock Market. I specialize in covering news related to the stock market and economic trends. With more than 8 years of experience in this field, I have become an expert in financial reporting.


