
- USD/MXN declines for the seventh consecutive day and hits two-week lows on Monday.
- Acceptance below the 61.8% Fibonacci retracement and negative oscillators support prospects for further decline.
- A sustained move above the 17.20-17.25 confluence hurdle is needed to negate the bearish outlook.
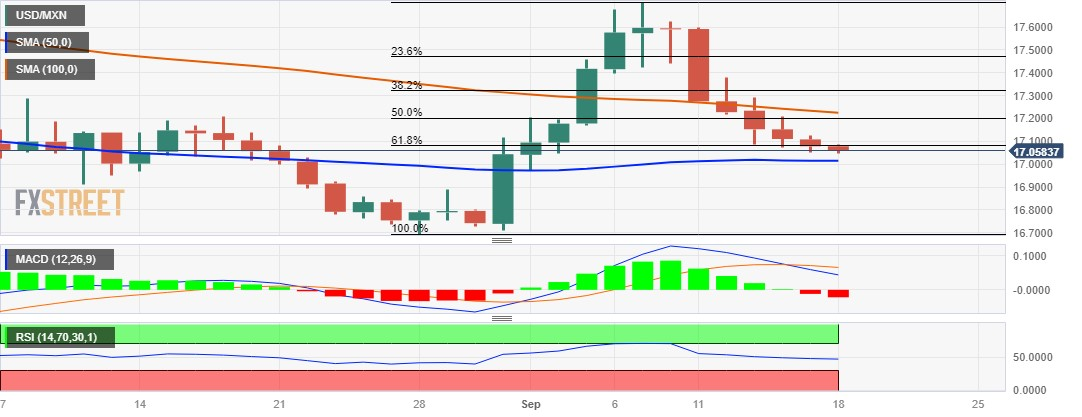
The USD/MXN pair remains under pressure for the seventh consecutive day and slides to more than two-week lows, around the 17.00 level on Monday.
From a technical perspective, the acceptance below the 61.8% Fibonacci retracement of the recovery from the August monthly low could have already set the stage for a further depreciating move in the pair. The negative outlook is reinforced by the fact that the oscillators on the daily chart have just started drifting into bearish territory. This, in turn, suggests that the path of least resistance for the USD/MXN pair is to the downside.
That said, it would be prudent to wait for a convincing break below the 50-day SMA, currently around the 17.0270 area, before opening new bearish positions. USD/MXN could then weaken further below the psychological level of 17.0000, to test the next relevant support near the 16.8885 area before falling to the multi-year low, near the 16.6945 region touched in August.
On the opposite side, any significant recovery could now face stiff resistance and is more likely to remain capped near the 17.2060-17.2280 confluence, which comprises the 50% Fibonacci and 100-day SMA. However, some follow-through buying should lift USD/MXN to the 38.2% Fibonacci area, around the 17.3300 region, en route to the 23.6% Fibonacci area near the 17.4775 area and multi-month high, in around the 17.7090-17.7095 area.
USD/MXN daily chart
USD/MXN additional technical levels
Source: Fx Street
I am Joshua Winder, a senior-level journalist and editor at World Stock Market. I specialize in covering news related to the stock market and economic trends. With more than 8 years of experience in this field, I have become an expert in financial reporting.


 on the water: her floating festival in Trieste is pure magic")


