
- USD/MXN gained ground on rising US jobless claims and falling inflation in Mexico, but then gave back some of the gains.
- Speculation of a pause in the monetary tightening cycle by Banxico fueled the rise of the USD/MXN.
- Markets attentive to the publication of US inflation data and the FOMC meeting.
After falling to 7-year lows on Wednesday around 17.30, USD/MXN rebounded to 17.44 on Thursday, though the pair has retreated to an intraday low of 17.34 on Friday. USD/MXN is trading at time of writing above 17.37, flat on the day, after ending Thursday’s session in the positive, with modest gains of 0.12%.
The Mexican Peso-Dollar pair reacts to cooling inflation in Mexico
Wall Street closed the session with solid gains. The USD/MXN pair rose on data from both countries, which supported the pair, as inflation in Mexico fell below estimates. According to the National Institute of Statistics, Geography and Informatics (INEGI), the Consumer Price Index (CPI) in May fell to -0.22% MoM, below estimates of -0.16%. In year-on-year terms, the CPI fell to 5.84% from 6.29% the previous month, below the consensus forecast of 5.9%.
Across the border, the US Bureau of Labor Statistics (BLS) filed the weekly claims for unemployment benefits for the week ending June 3, which rose to 261,000, above the 232,000 expected by analysts, the highest number since October 2021.
After the publication of both data, the USD/MXN advanced from 17.3500 to the daily maximum of 17.4426, on speculation of a pause in the tightening cycle of the Bank of Mexico (Banxico). As for the US Federal Reserve (Fed), last week’s comments reinforced the idea of not raising rates in June and waiting for July.
However, recent monetary policy decisions by the Reserve Bank of Australia (RBA) and the Bank of Canada (BoC) raised concerns about what the Fed will do. With the RBA and BoC keeping rates on hold, the Inflation has resumed its upward path in some meetings. This provoked the reaction of both institutions.
Upcoming events
The US calendar is empty, with an eye on Tuesday June 13, when the inflation data is released, and Wednesday June 14, with the FOMC meeting.
USD/MXN Price Analysis: Technical Perspective
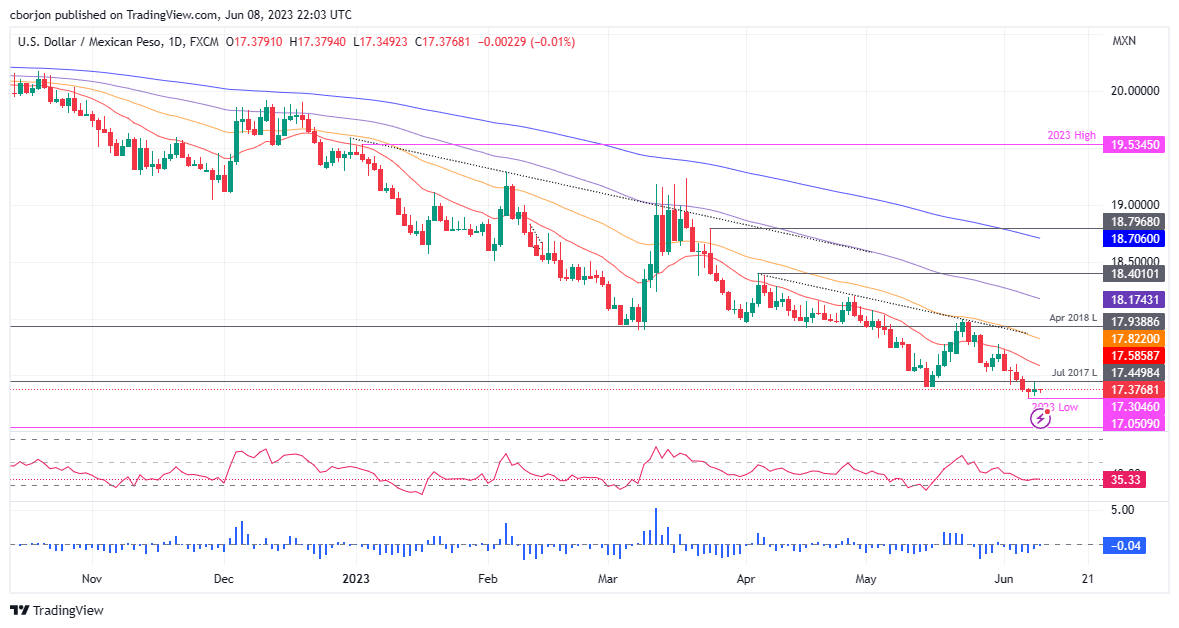
The daily chart shows the pair USD/MXN biased down, although it seems to be hitting rock bottom. Although it has already been discussed in previous articles, it should be taken with caution. A double bottom could be forming, but it would need to reclaim two daily EMAs, the 20 and 50 day EMAs each at 17.5851 and 17.8217, before challenging resistance at the May 23 high at 17.99. Once broken, the next bid zone to test would be the 100-day EMA at 18.1741. Conversely, the pair could continue to make new multi-year lows below the current low of 17.30.
Source: Fx Street
I am Joshua Winder, a senior-level journalist and editor at World Stock Market. I specialize in covering news related to the stock market and economic trends. With more than 8 years of experience in this field, I have become an expert in financial reporting.


